


Big Jump in the Months of Supply of Homes for Sale in Phoenix
It could be a fluke but we saw a big jump in the months of supply over the last 2 weeks, from 2.0 months of supply to 2.7 months of supply.
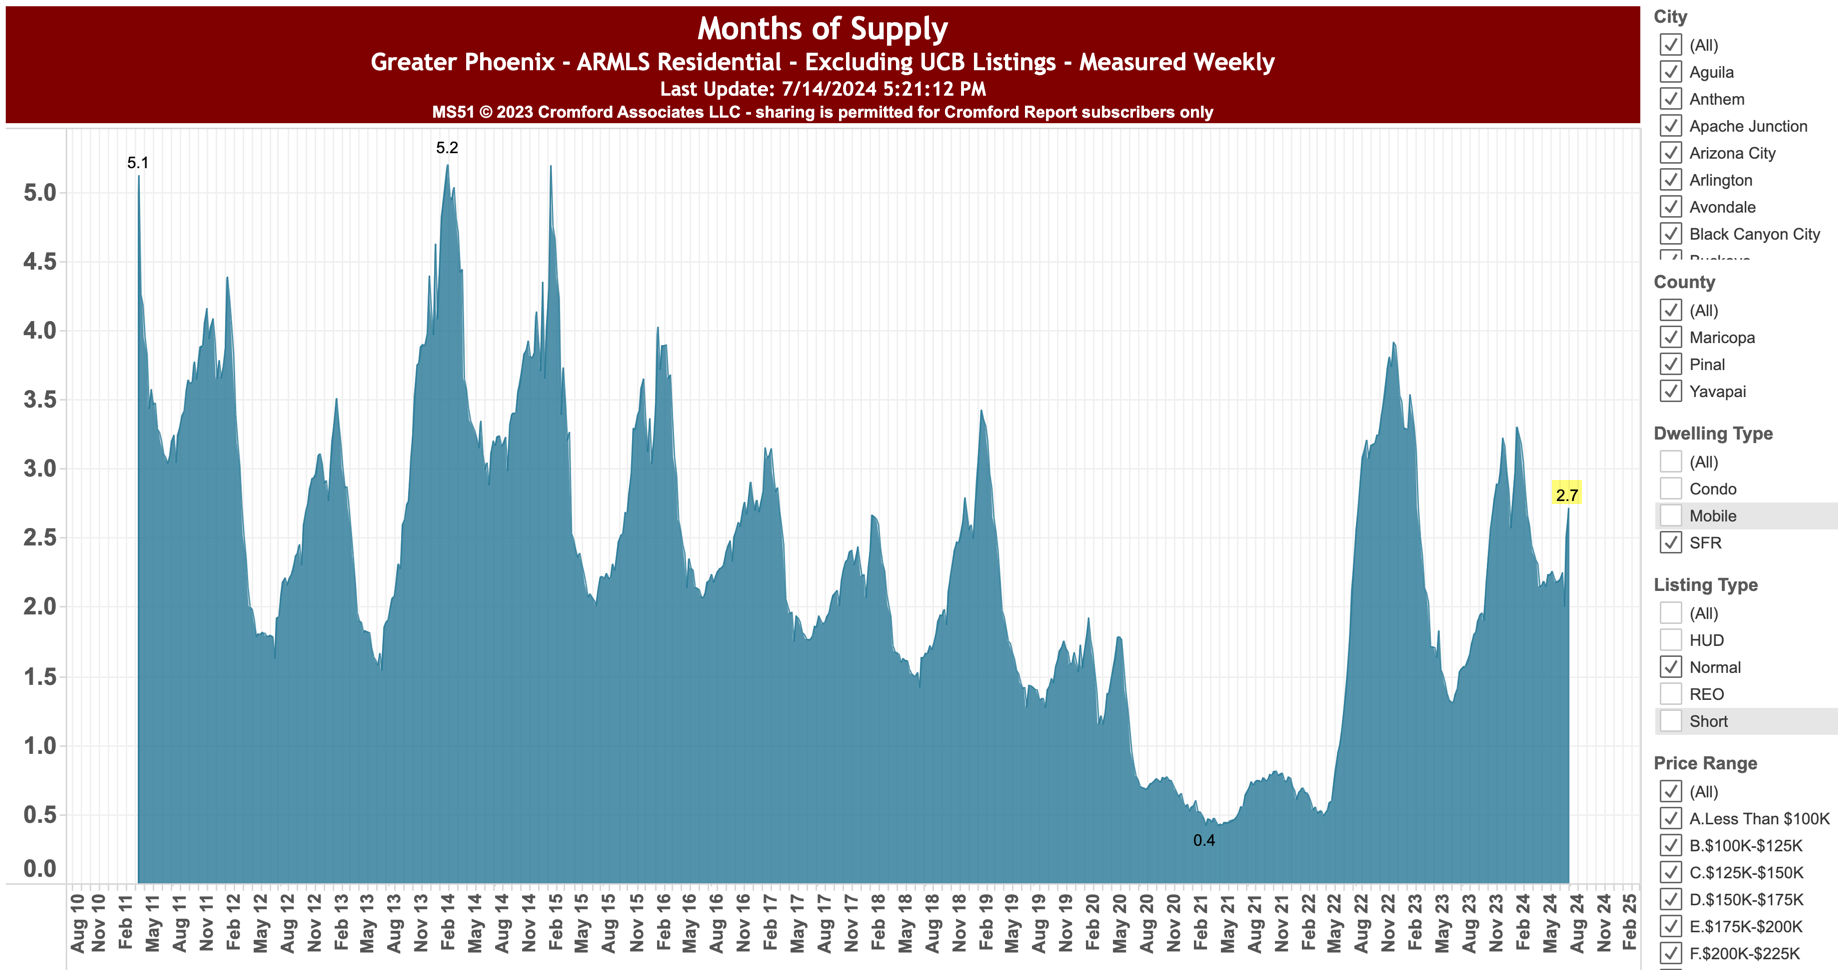
We’ll need to watch this closely.
Homes for Sale = “Normal”
For the last 3 weeks, homes for sale in the Phoenix MLS have been tracking close to 2017, a "normal" year.
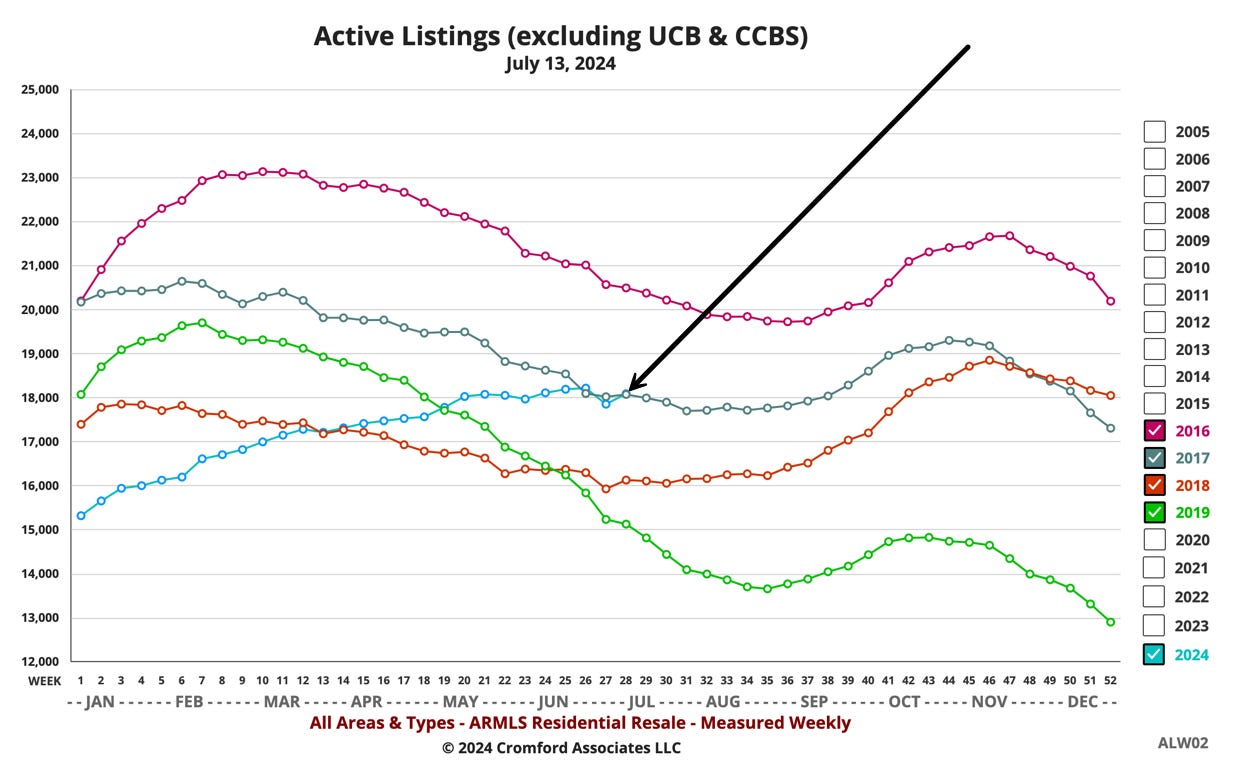
Is the abnormal increase in the number of homes for sale we saw during the first 6 months of 2024 now over? Probably not. We'll know in a few weeks.
Phoenix Evictions Make the National News!
Economic Club of Phoenix
Great summary of the economic outlook from the Economic Club of Phoenix last May. A lot of real estate discussion.

Video of the entire meeting, here.

"What will the pullback in multifamily construction permitting mean for the rental market?"

I Always Like Reading the Combs Law Group Newsletter
- Combs Law Group website.
You can subscribe to their free newsletter, here.
Click on the graphs to go to the full-size, interactive versions.

Notice how very small changes in New Listings and Solds eventually cause HUGE changes in the number of houses For Sale and house Prices (see graph above).

This information can vary a lot in different parts of metro Phoenix. Your real estate agent can find the data for your specific city or zip code at The Cromford Report.
One has to wonder what part climate change has to do with this jump in listings.and decline in sales. There is no question that a massive portion of our population left once.daily temperature records started. Also no question out of.towners stopped coming here if they could.
Will those who moved here to escape COVID restrictions leave as the summer blazes on?
Is this a short term event or are there long term ramifications?
It's not like our grandparents' market any longer. Wonder what it's going to become.