


First 6 Months of 2025 – Phoenix Housing Market
Number of Homes Put Up for Sale
The number of single-family homes hitting the market was a lot higher in the first 3 months of 2025 than in 2024.

But then the number of single-family homes hitting the market slowed down in April, May & June and was almost back to 2024 levels.

Homes Sold
The number of single-family homes sold in the first 3 months of 2025 was almost identical to 2024, but sales in April, May & June were a bit higher in 2025 than in 2024.

Supply of Homes for Sale Jumps, then Flattens Out
The result of a lot more homes hitting the market but flattish home sales was that the number of unsold homes for sale kept building up. The supply of all homes for sale jumped up in the first 4 months of 2025, then flattened out in May, and then started to fall in June. By the end of June, the supply of homes for sale was 43% higher than a year earlier.

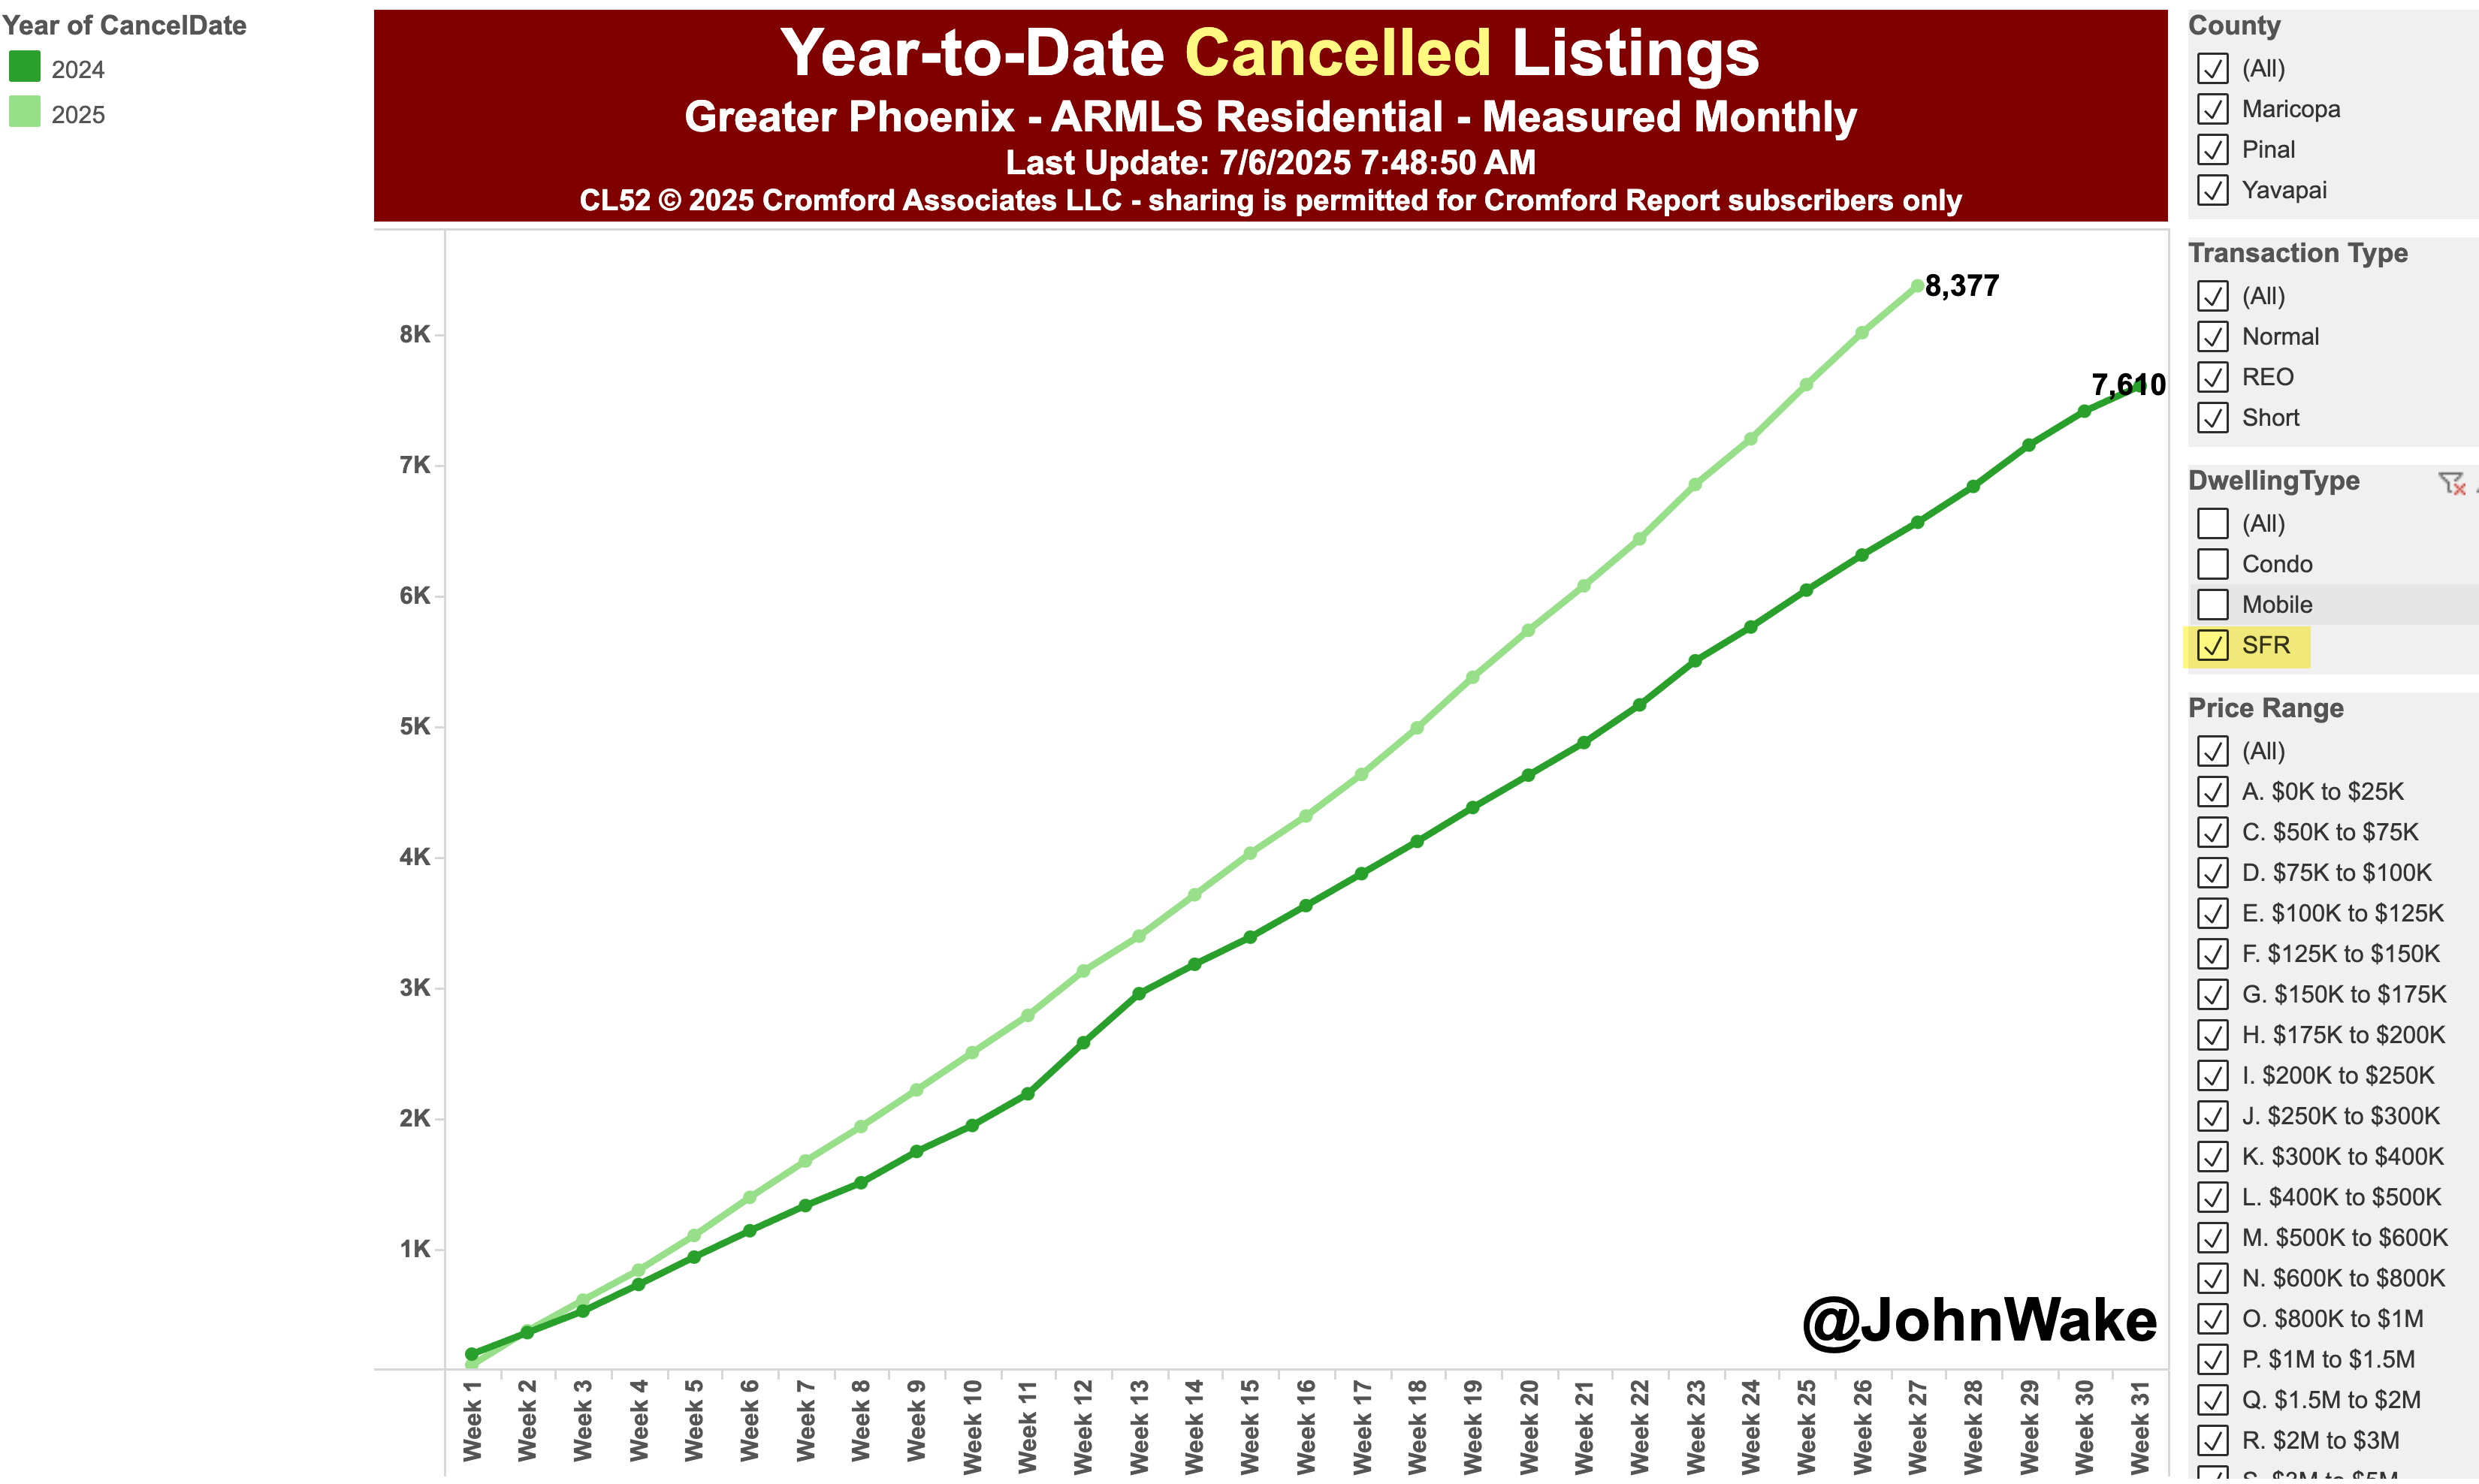
Cancelled and Expired Listings
As 2025 went on, we saw more and more homes taken off the market unsold. Either the sellers pulled their houses off the market (cancelled their listing agreements with their agents), or the listing agreements the sellers had with their real estate agents expired, and those sellers chose not to renew the agreements so their homes were taken off the MLS.

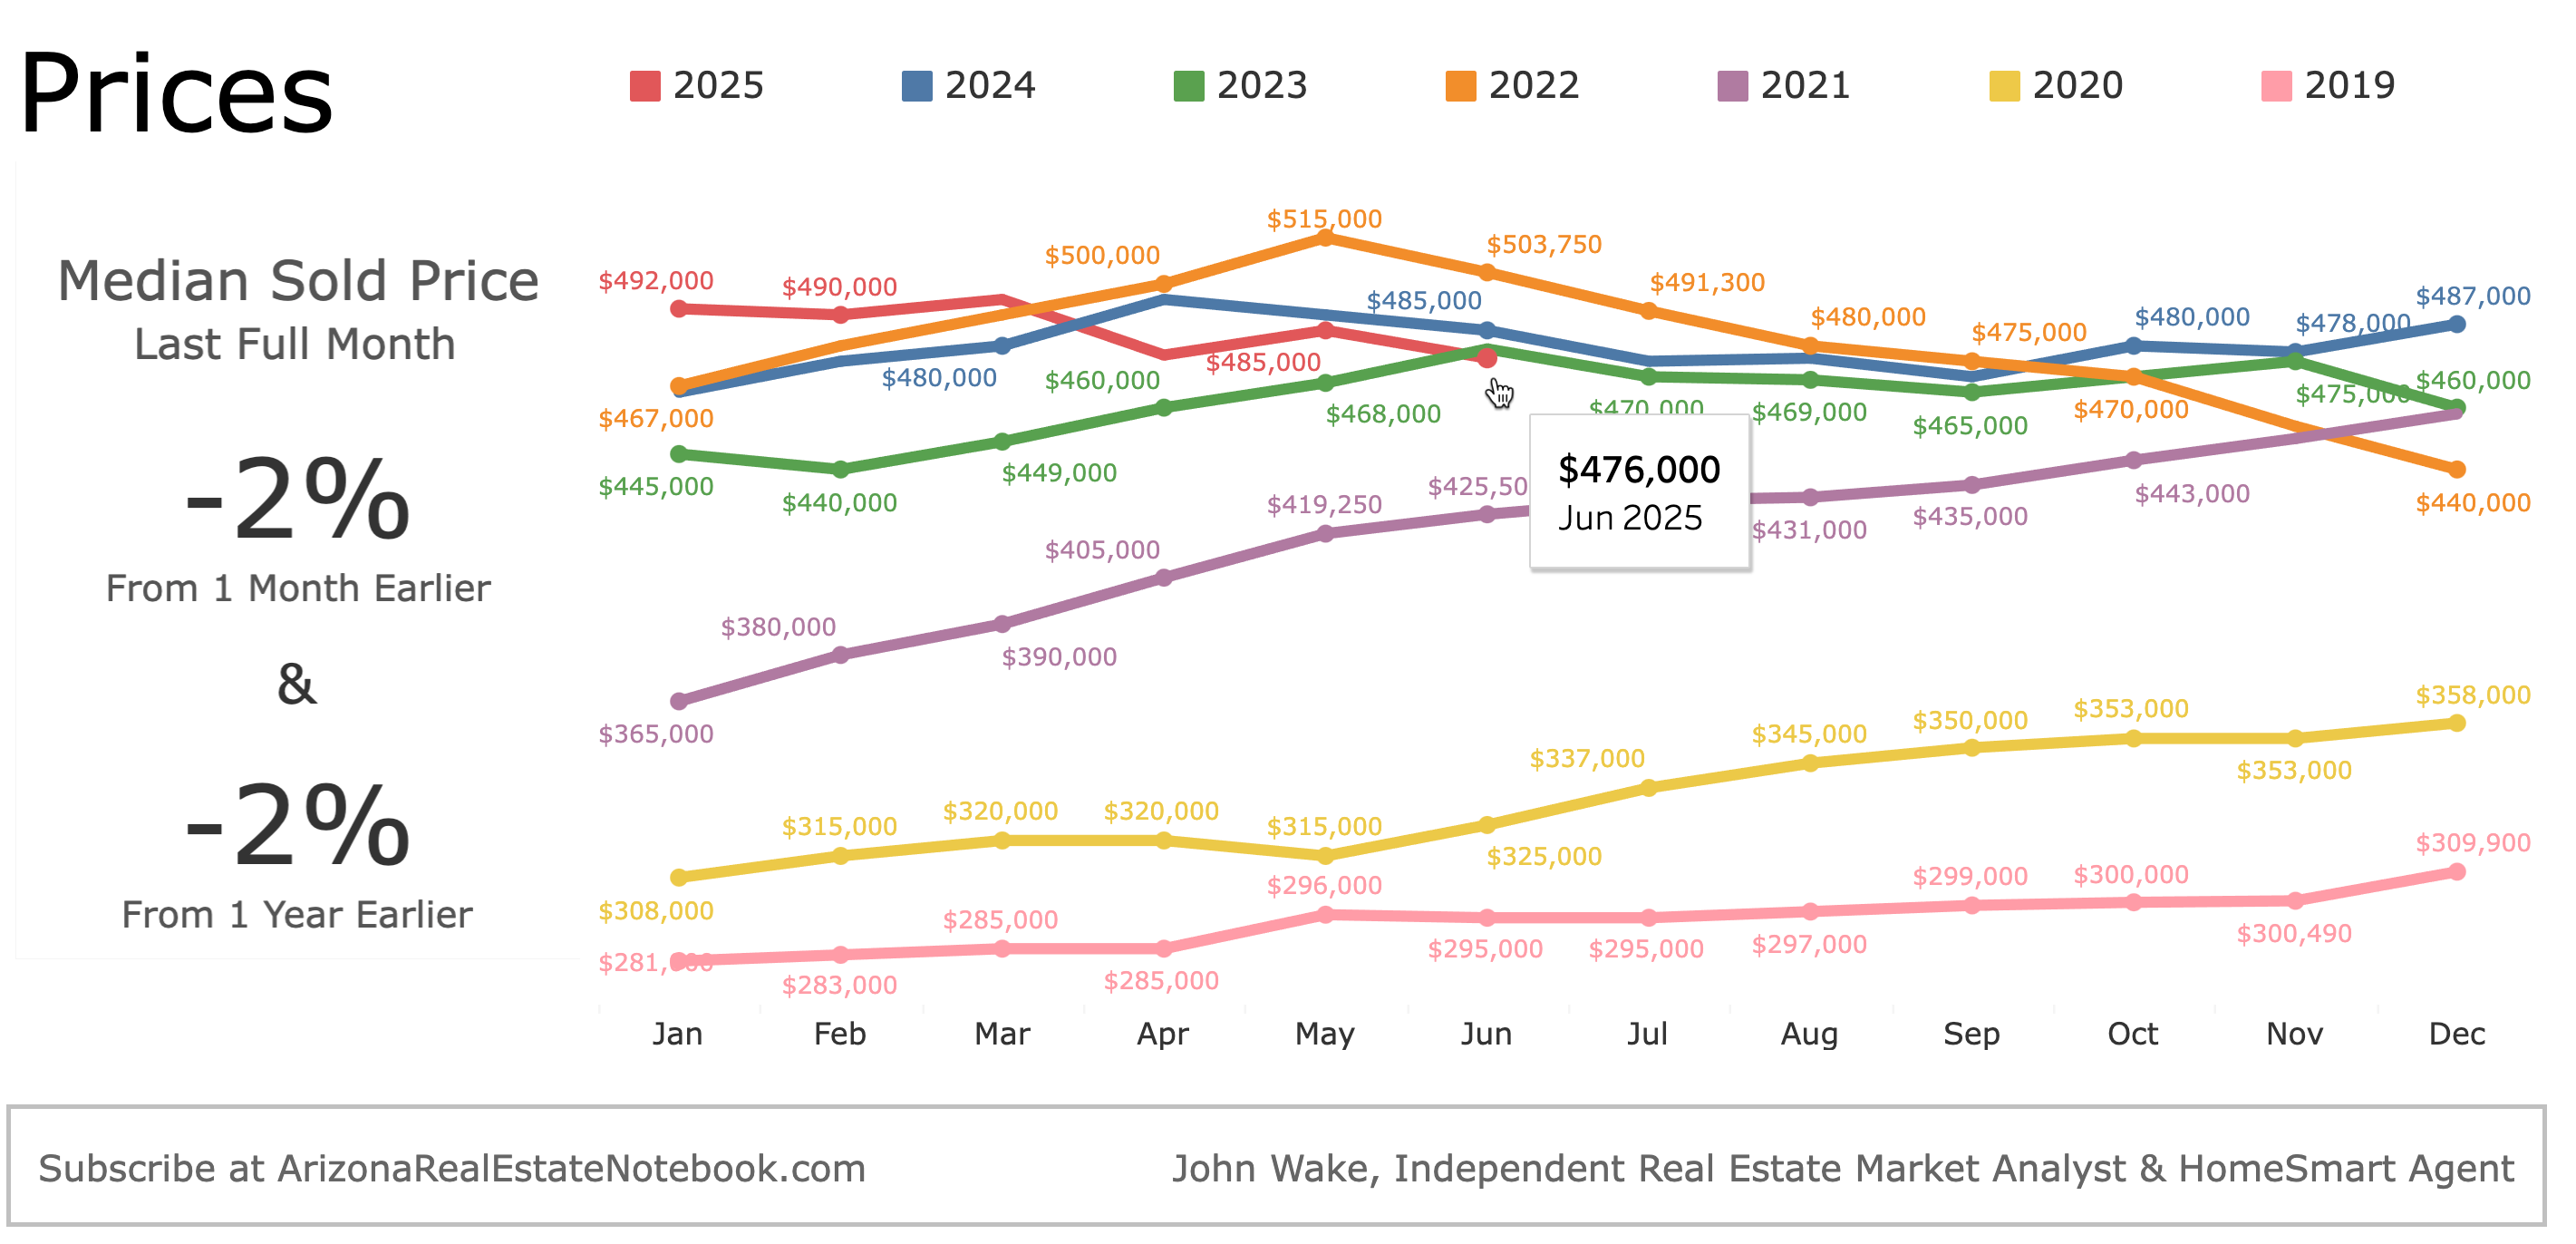
Single-Family Home Prices
What’s Next?
The supply of homes for sale is at the very top of the normal range. If it starts increasing again, that would put a lot of downward pressure on Phoenix home prices.
If we go into a recession, that would be very bad for home prices.
Although foreclosures are low now, some analysts I respect think foreclosures will increase next year after FHA stops giving away so many mortgage modifications this October. In addition, ending student loan forbearance will hurt housing demand to some degree.
I suspect the increased federal deficits caused by the One Big Beautiful Bill will keep interest rates higher than they would be otherwise.
The least bad scenario seems to be that home prices fall, but not a ton, and then they are flattish, and inflation brings real home prices back in line over many years.
Kinda like the S&L housing boom and bust. U.S. home prices peaked in 1989. Real, inflation-adjusted home prices fell 7% from the peak until the end of 1990, but real home prices continued to fade for years until they bottomed out in 1997, down 14% from the 1989 peak, 8 years earlier.
Click on the graphs to go to the full-size, interactive versions.

Notice how very small changes in New Listings and Solds eventually cause HUGE changes in the number of houses For Sale and house Prices (see graph above).

This information can vary a lot in different parts of metro Phoenix. Your real estate agent can find the data for your specific city or zip code at The Cromford Report.