


Largest Supply of Homes for Sale in Phoenix since 2014
Rising like a Phoenix

h/t @Woningnieuws
Supply of Homes Up 47% from Last Year
But supply might finally be starting to level off.

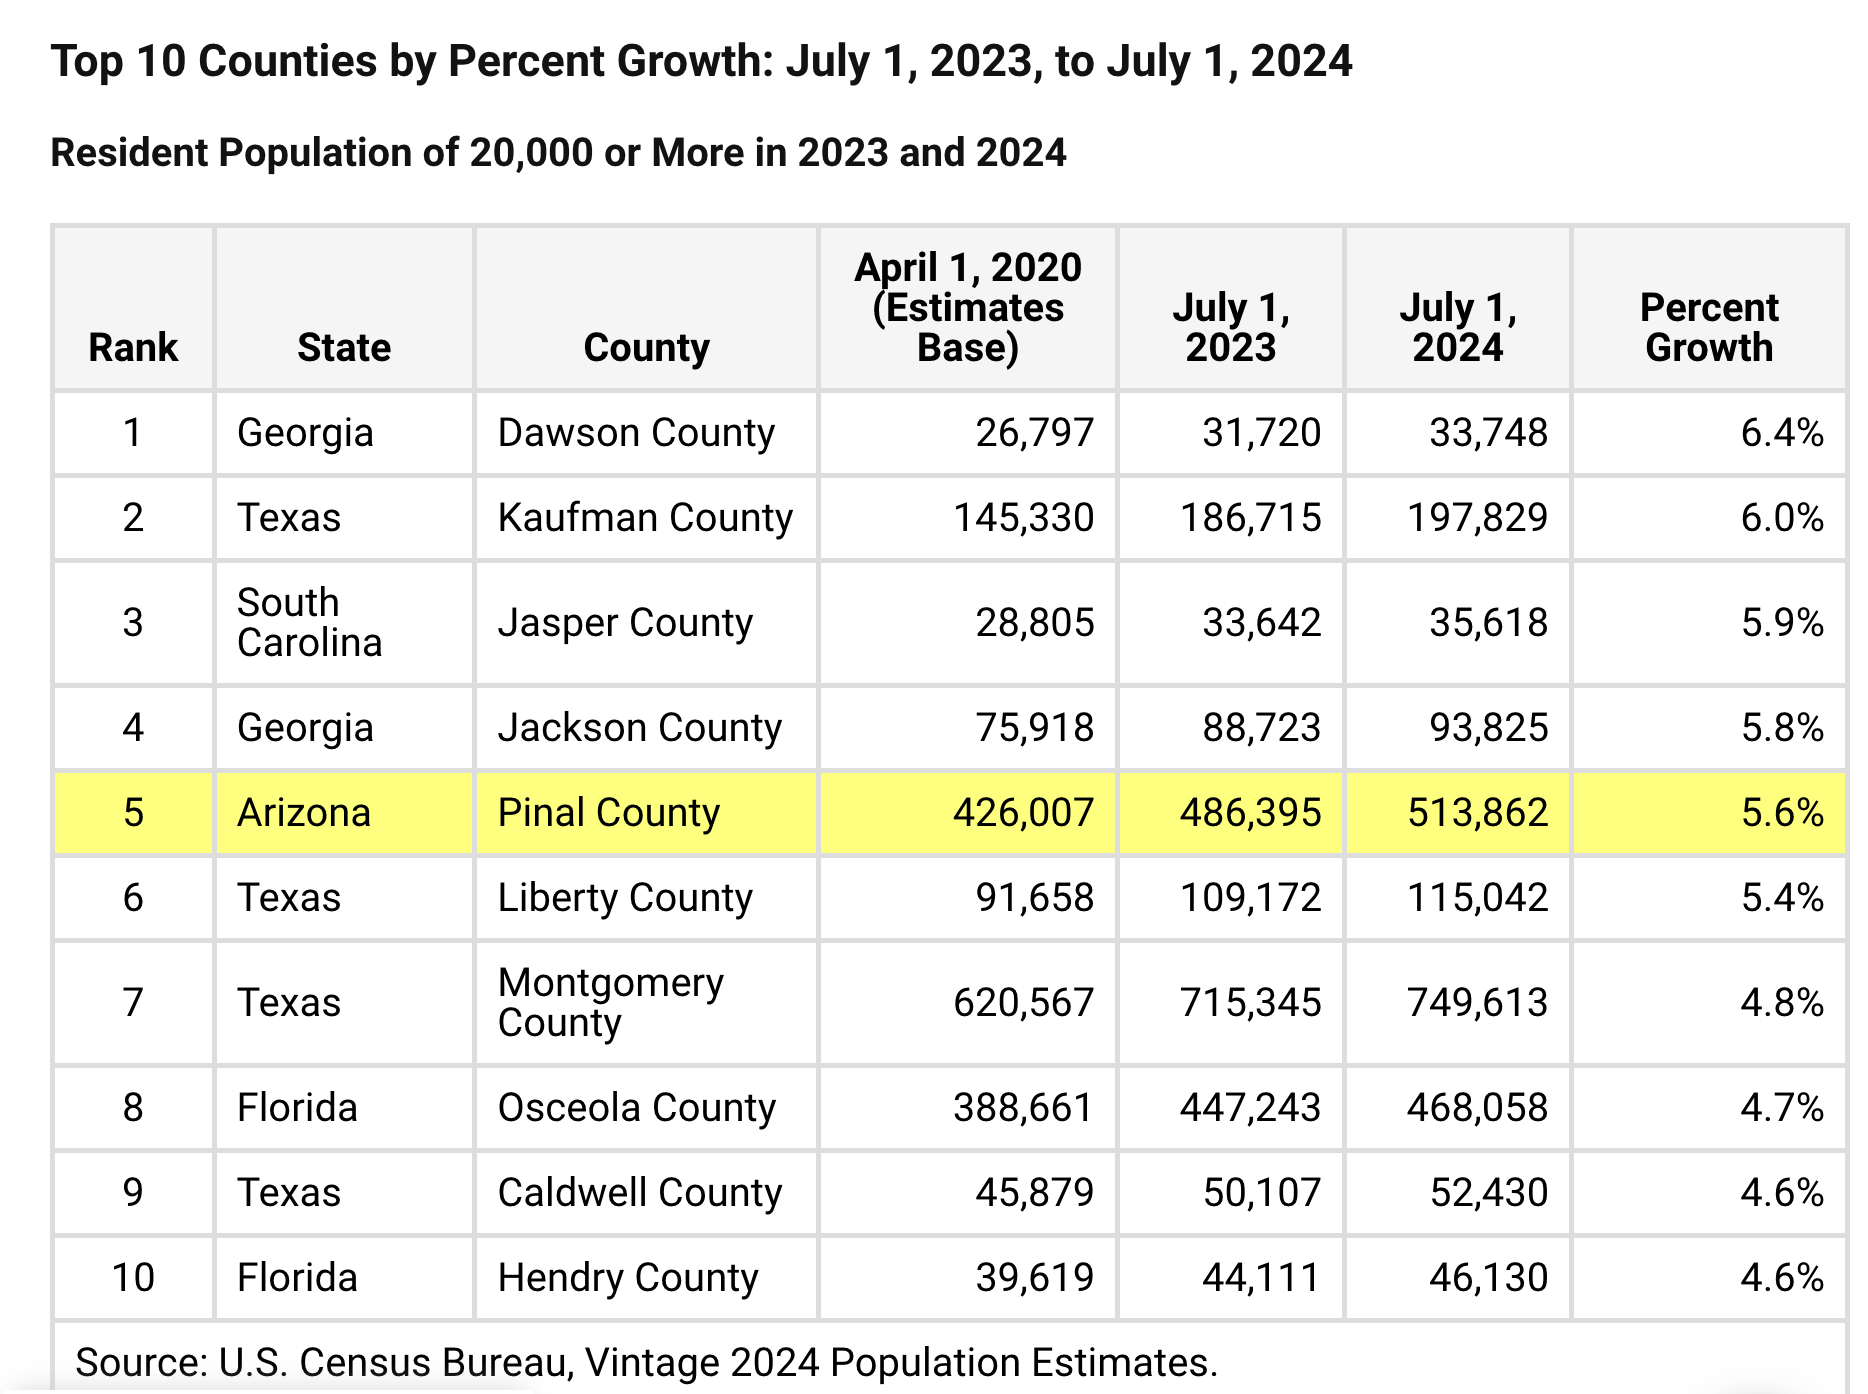
Maricopa County #3 for Population Growth

But Pinal County Growing Faster Percentage-wise
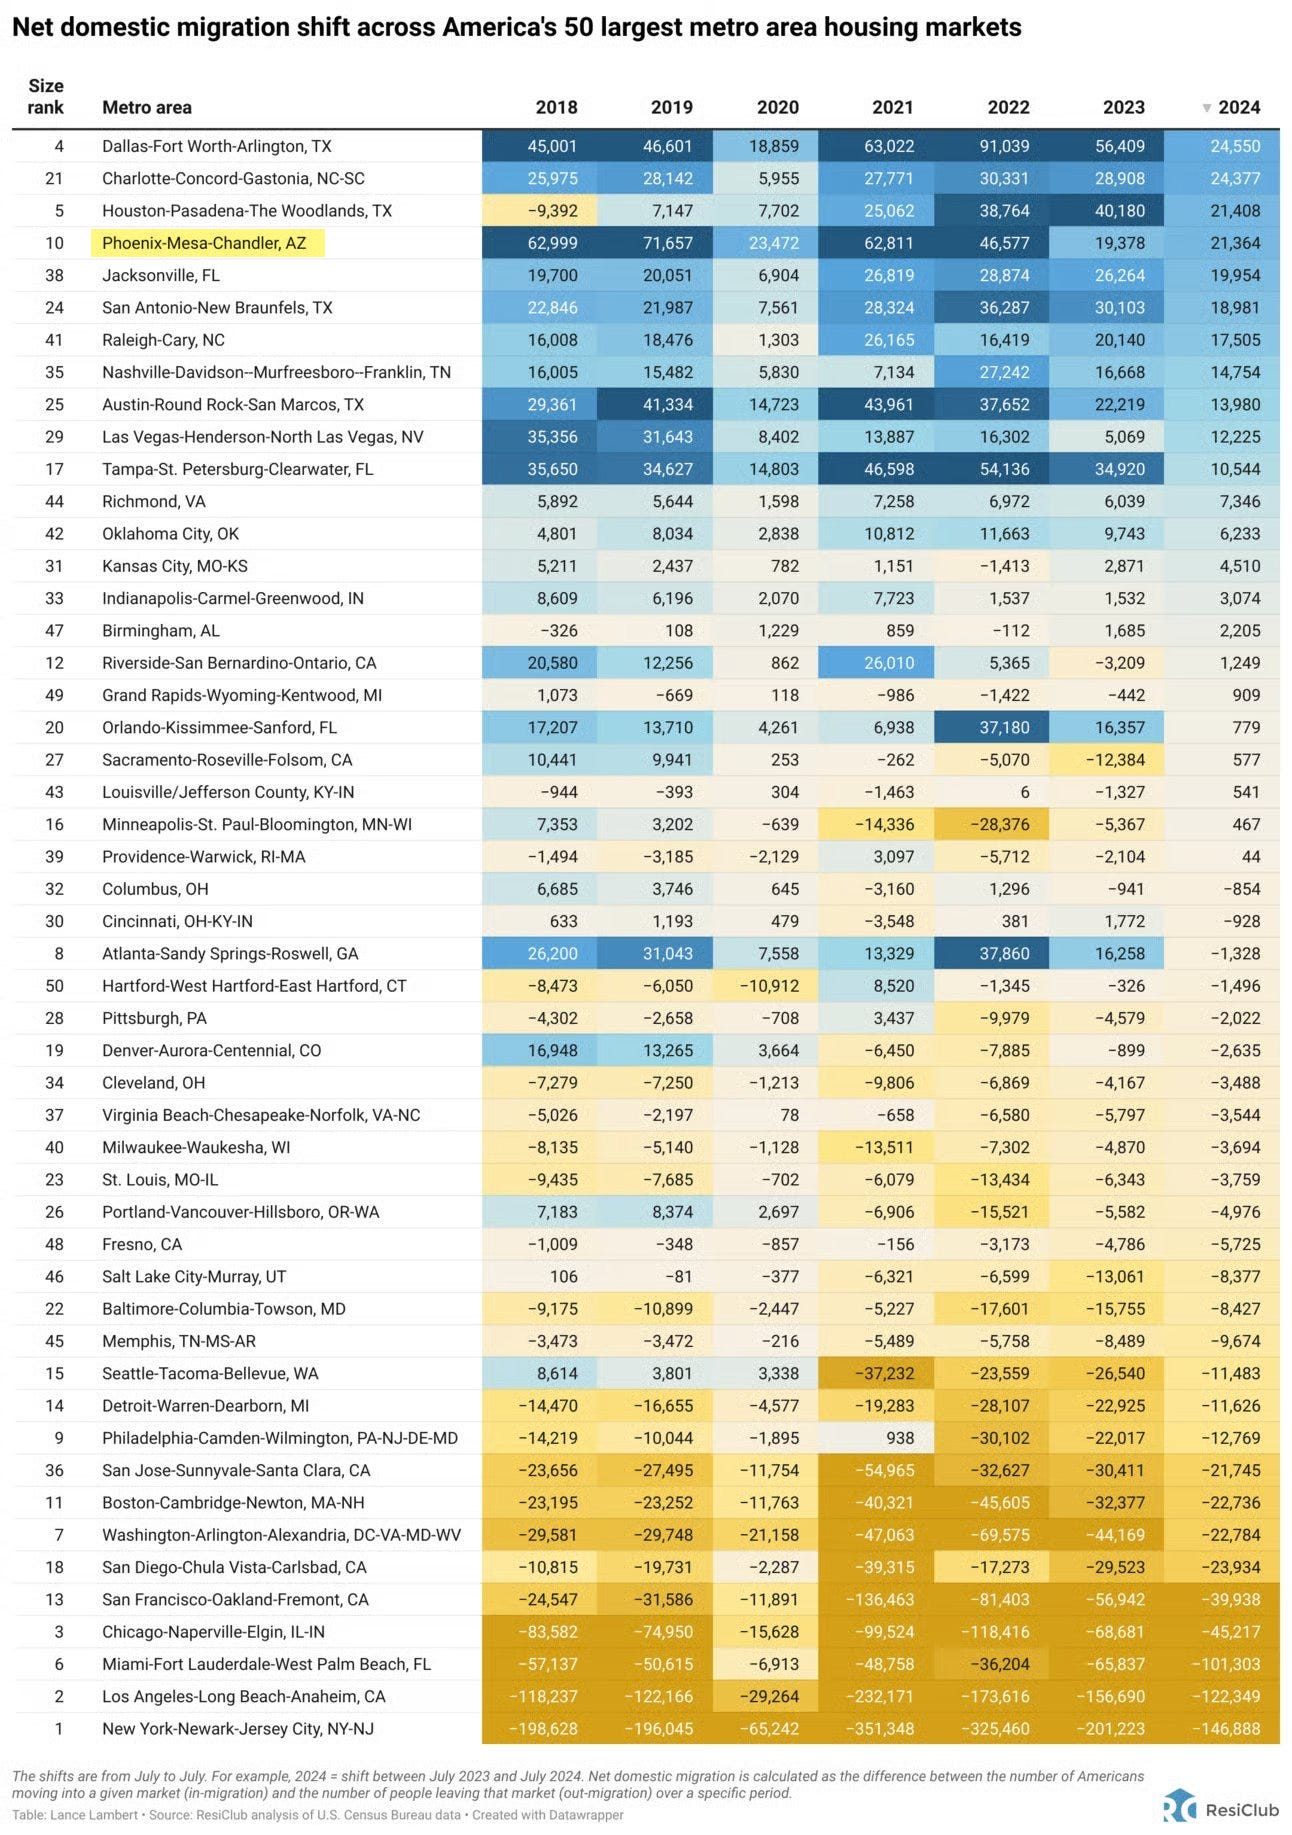
Phoenix #4 for Net Domestic In-Migration
But Arizona Construction Employment Down 3.4% from Last Year

Click on the graphs to go to the full-size, interactive versions.

Notice how very small changes in New Listings and Solds eventually cause HUGE changes in the number of houses For Sale and house Prices (see graph above).

This information can vary a lot in different parts of metro Phoenix. Your real estate agent can find the data for your specific city or zip code at The Cromford Report.