
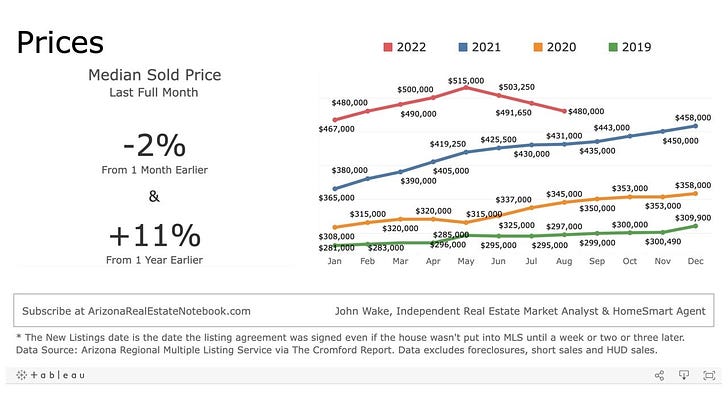

Phoenix House Prices Fell about $10,000 per Month for the Last 3 Months


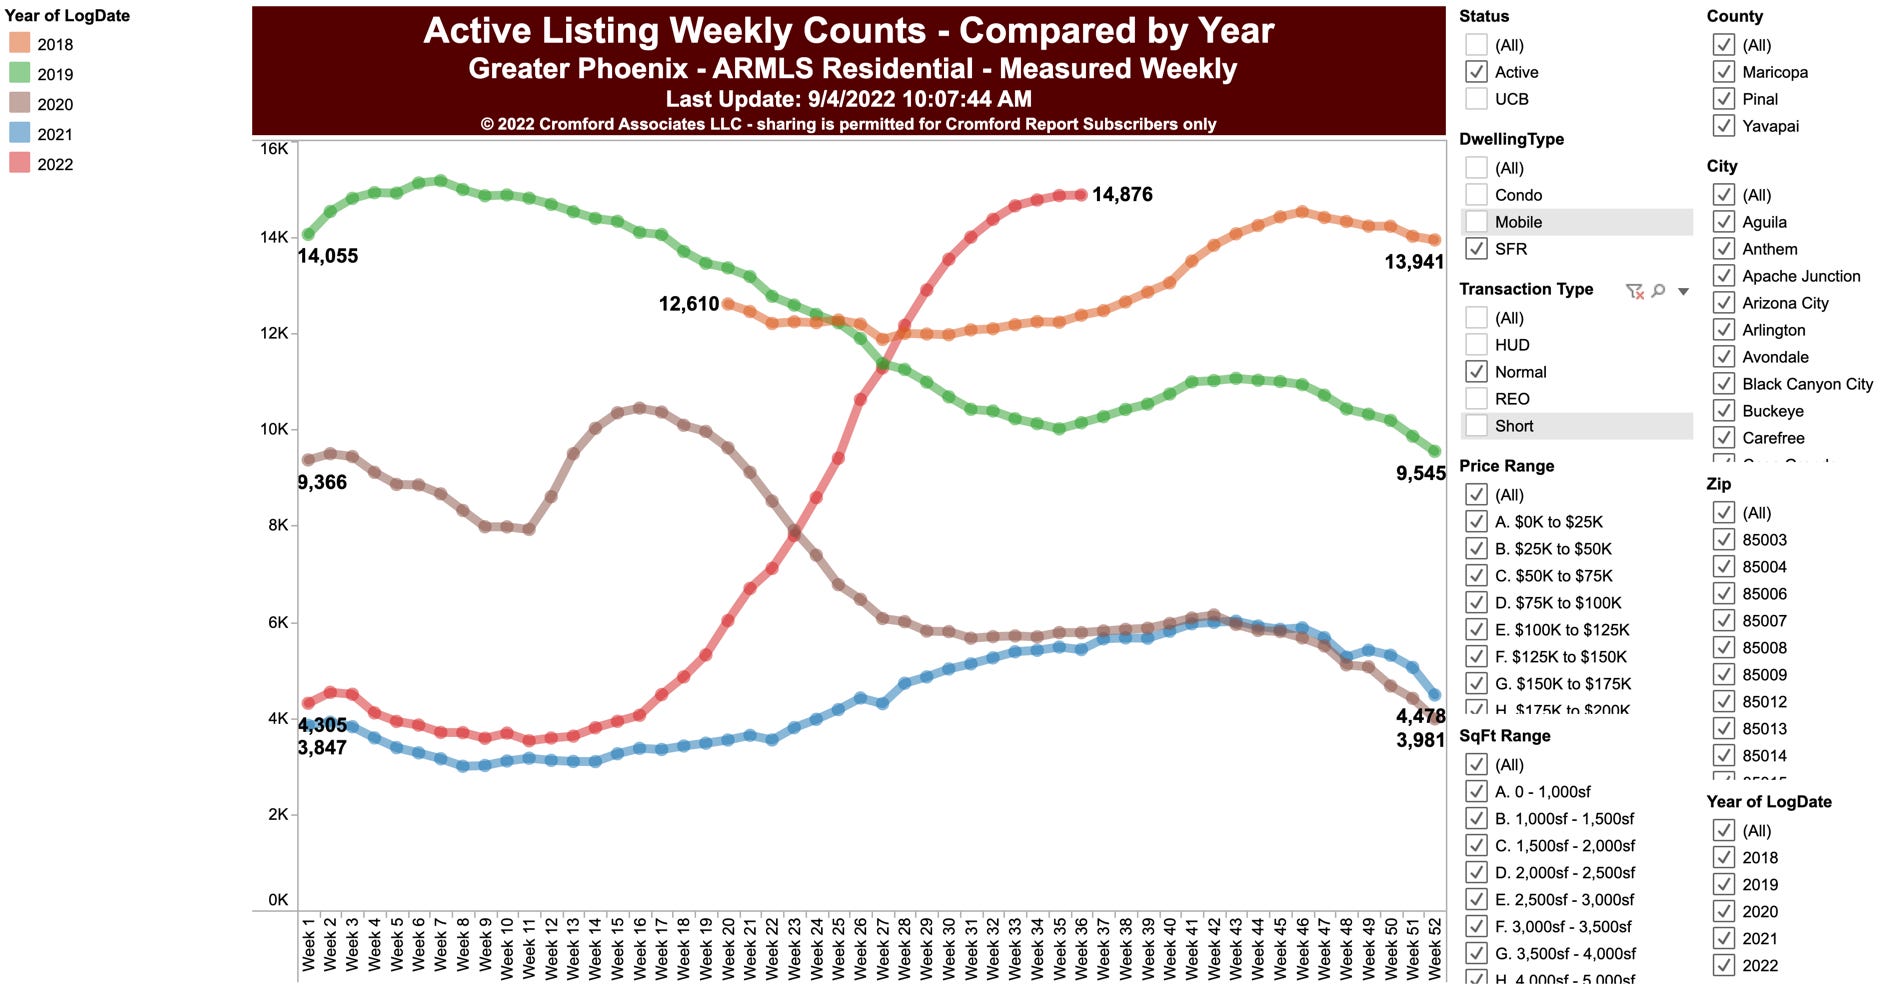
Number of Single-Family Houses Listed for Sale in Phoenix MLS
Top 10 Tweets of the Week
This Tweet of mine kinda went viral.

Real estate attorney says about half his phone calls these days are disputes about buyers canceling contracts.
Phoenix metro MLS
In August 2022, the total number of showings was down 24%, and the average number of showings per house was down 42% compared to August 2021.
Quantifying demand.
Apartments.com Publishes July 2022 Rent Growth Report
Apartment rents down 0.4% in Phoenix from June to July. Will the trend continue? Gain speed?
costargroup.com/costar-news/de…

Phoenix rents only up 2% in last 6 months, the slowest of any large metro, according to Apartment List.
Of course rents are up 35% since March 2020 but will the tide turn and rents start to fall?

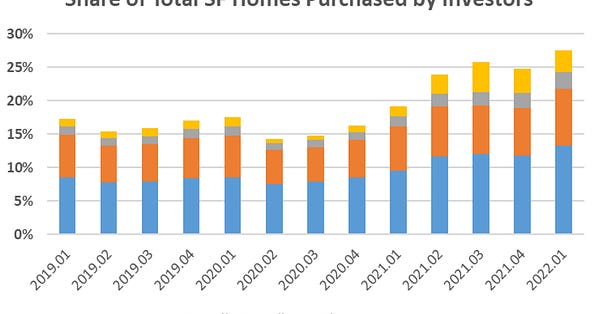
According to Corelogic, investors bought 37% of all single-family houses in Phoenix in Q1 2022!
"So, when people are cancelling, are they saying why? And this builder said, oh, they're just the investors that you know, realize home prices have peaked."
Will the increase in evictions put downward pressure on rents?

A big reason Phoenix had the highest house price increases in the Case-Shiller dataset from the summer of 2019 until January of this year.
jchs.harvard.edu/son-2022-migra…


Humble Brag
I created my first Case-Shiller viz in Tableau in 2016.
I've added dozens of dashboards over the years.
Overall, the workbook has had over 2.5 million views!

Click on the graphs to go to the full-size, interactive version.

Notice how very small changes in New Listings and Solds eventually cause HUGE changes in the number of houses For Sale and house Prices (see graph above).

This information can vary a lot in different parts of metro Phoenix. Your real estate agent can find the data for your specific city or zip code at The Cromford Report.