


Phoenix Inflation-Adjusted Home Prices the Same as 2 Years Ago
Real Phoenix Home Prices
• Higher than in 2005
• Same as 2 years ago and 3.5 years ago


Normalish
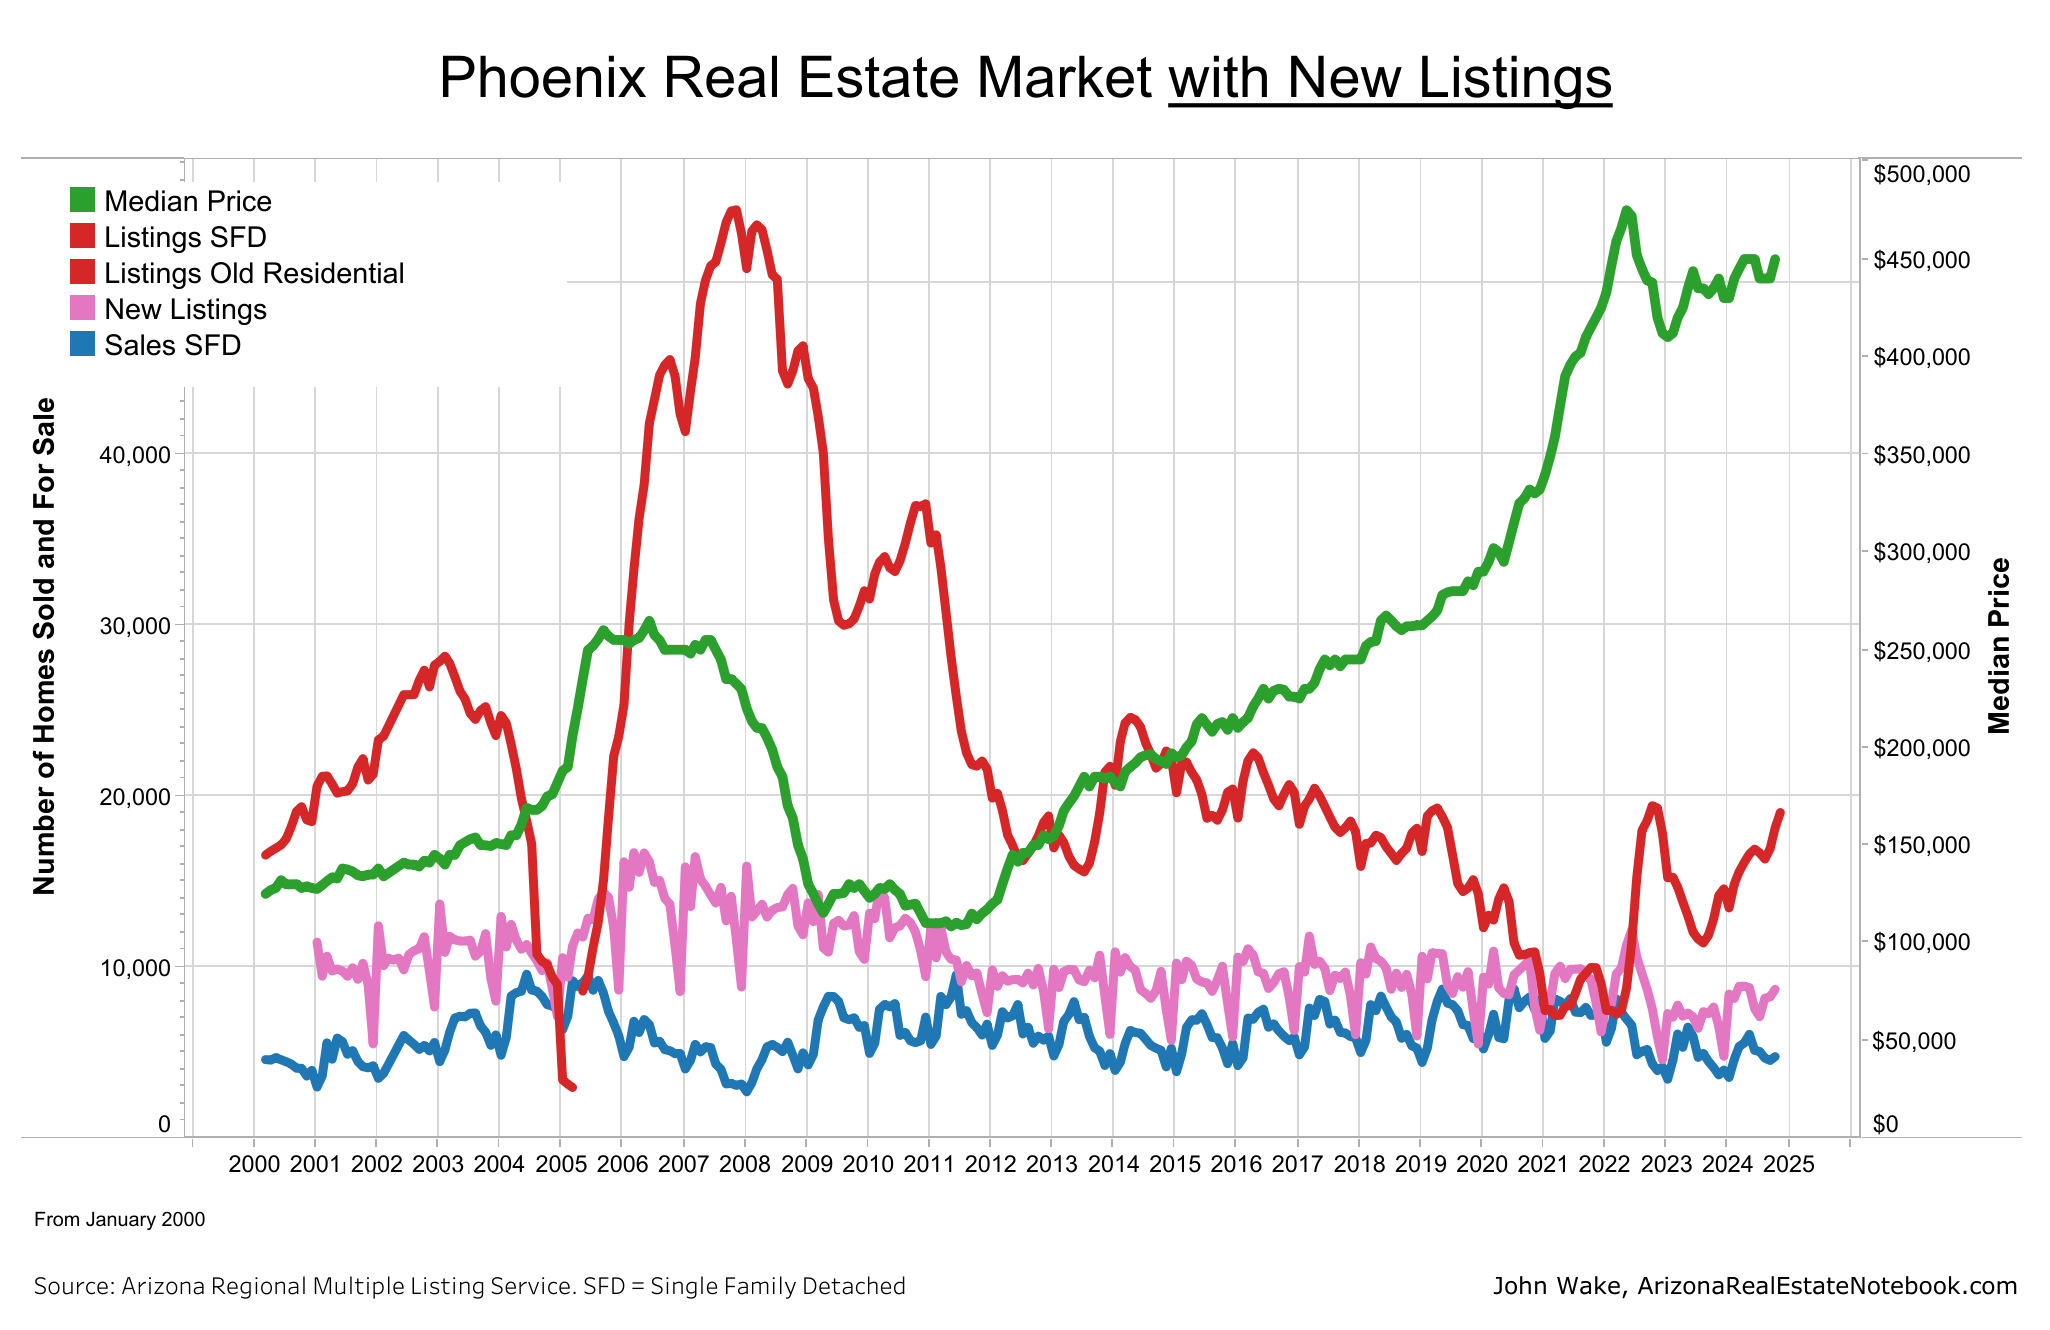
The number of homes we have listed for sale in the MLS in Phoenix is "normalish" although we do have more people living here than 10, 20 years ago.
Not a ton of downside price risk at these levels but the supply of homes for sale is increasing pretty fast.
Zoning is NOT Causing Low Supply and High Prices
37% more permits granted than single-family homes sold in metro Phoenix 2020 to 2022.
• 92,811 = Building Permits Granted
• 67,791 = New Homes Sold
The Great Deflection. Builders always blame the housing crisis on zoning.

Phoenix Economic Outlook
“Dennis Hoffman, ASU economics professor, "He predicted that the net employment gain of 69,800 for metro Phoenix in 2023 will be followed by increases of 55,900 this year and 51,400 in 2025. After metro Phoenix added a net 92,100 newcomers in 2023, he expects roughly similar population increases for area this year and in 2025."
"As for risks, Hoffman cautioned that housing is no longer inexpensive here"
Click on the graphs to go to the full-size, interactive versions.

Notice how very small changes in New Listings and Solds eventually cause HUGE changes in the number of houses For Sale and house Prices (see graph above).

This information can vary a lot in different parts of metro Phoenix. Your real estate agent can find the data for your specific city or zip code at The Cromford Report.