Arizona Real Estate Notebook

Share this post

Price per Square Foot of Sold Houses Down 4% in 1 Month in Phoenix

arizonarealestatenotebook.substack.com

Price per Square Foot of Sold Houses Down 4% in 1 Month in Phoenix

John Wake
Jul 18, 2022
1
Share this post

Price per Square Foot of Sold Houses Down 4% in 1 Month in Phoenix

arizonarealestatenotebook.substack.com

Updated the long-term monthly graphs.


John in the News

Wow! After getting quoted in Newsweek and Business Insider last week, I got quoted in Fortune and Seeking Alpha this week! Real estate must be THE story nationally right now.


Price per square foot down a “massive” 4% from June 15 to July 15

Mike Orr at The Cromford Report.

“For the monthly period ending July 15, we are currently recording a sales $/SF of $291.74 averaged for all areas and types across the ARMLS database. This is down a massive 4.2% from the $304.50 we now measure for June 15.”

“What really defeated our forecasting model is that sold prices went from 101% of list to 99.3% of list in just a single month. We have never experienced such a huge swing in such a short time before.”

Possible Small Rebound. Mike, however, expects a bit of a rebound in the next 30 days – average sold price per square foot +1.4% – because the average price of listings under contract on July 15 was a bit higher than on June 15.

However, I’m thinking that if the sale-price-to-list-price ratio continues to fall, that would lower sale prices more than expected. From 2014 to 2019 that ratio ran in the 96.5% to 98.0% range.

Inventory

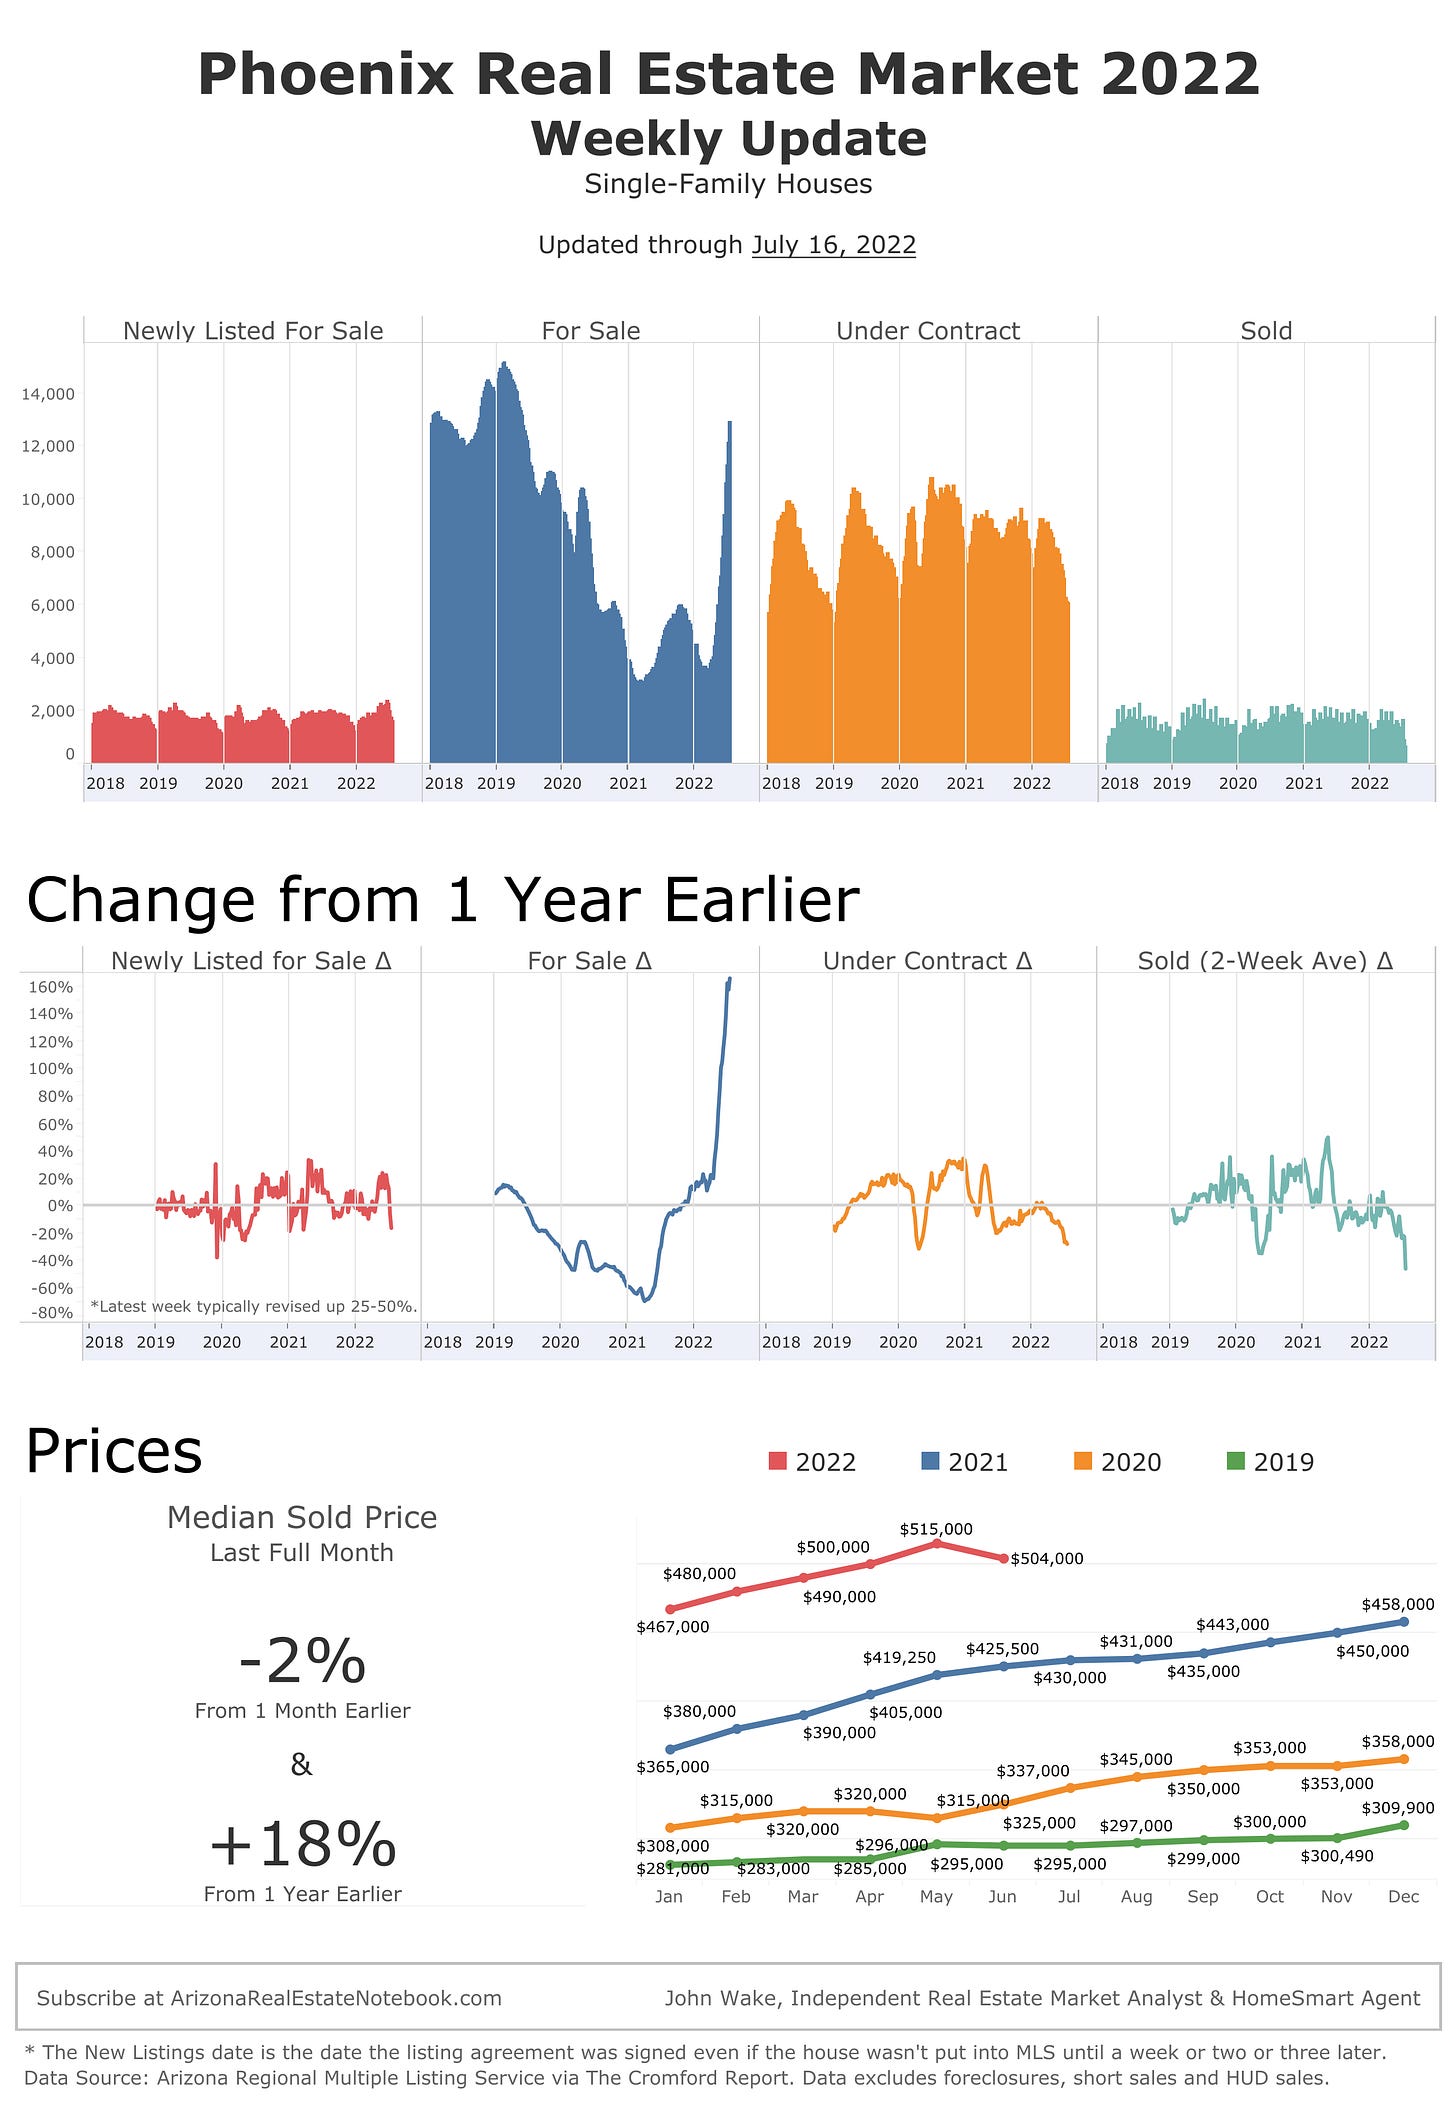
The number of single-family, non-distressed houses listed for sale in the Phoenix MLS continues to skyrocket. At this rate, in a few weeks the number will be higher than anytime in 2018 or 2019.


The Tweet thread below is based on the latest monthly report on the Phoenix real estate market from the amazing Tom Ruff of “The Information Market.”

Twitter avatar for @JohnWake
John Wake @JohnWake
"A decrease is forecasted in July for average and median sale prices" "median sales price is projected to decline 5.3% month over month." "Permission is granted only to ARMLS® Subscribers for reproduction with attribution on to “ARMLS® COPYRIGHT 2022." armls.com/docs/2022-June…
Image
8:36 PM ∙ Jul 15, 2022
18Likes5Retweets
Twitter avatar for @JohnWake
John Wake @JohnWake
"As of today, supply is up 38.6% month-over-month and 237.3% year-over-year." "At the beginning of July, the pending contracts are 25.87% lower than last year.
Image
8:36 PM ∙ Jul 15, 2022
6Likes3Retweets
Twitter avatar for @JohnWake
John Wake @JohnWake
Sold prices are now back below list prices, on average, like normal.
Image
8:36 PM ∙ Jul 15, 2022
6Likes2Retweets
Twitter avatar for @JohnWake
John Wake @JohnWake
"In June, institutional buyers accounted for 8.8% of all home purchases in Maricopa County... Closing numbers through the first 11 days of July show their overall market share rising to 9.6%." FYI, there were no institutional investor buyers before 2010.
8:36 PM ∙ Jul 15, 2022

I got mentioned in Seeking Alpha!

Twitter avatar for @JohnWake
John Wake @JohnWake
I got a mention in Seeking Alpha from Garrett Duyck. seekingalpha.com/article/452297…
Image
6:18 PM ∙ Jul 15, 2022

Click on the graphs to go to the full-size, interactive version.


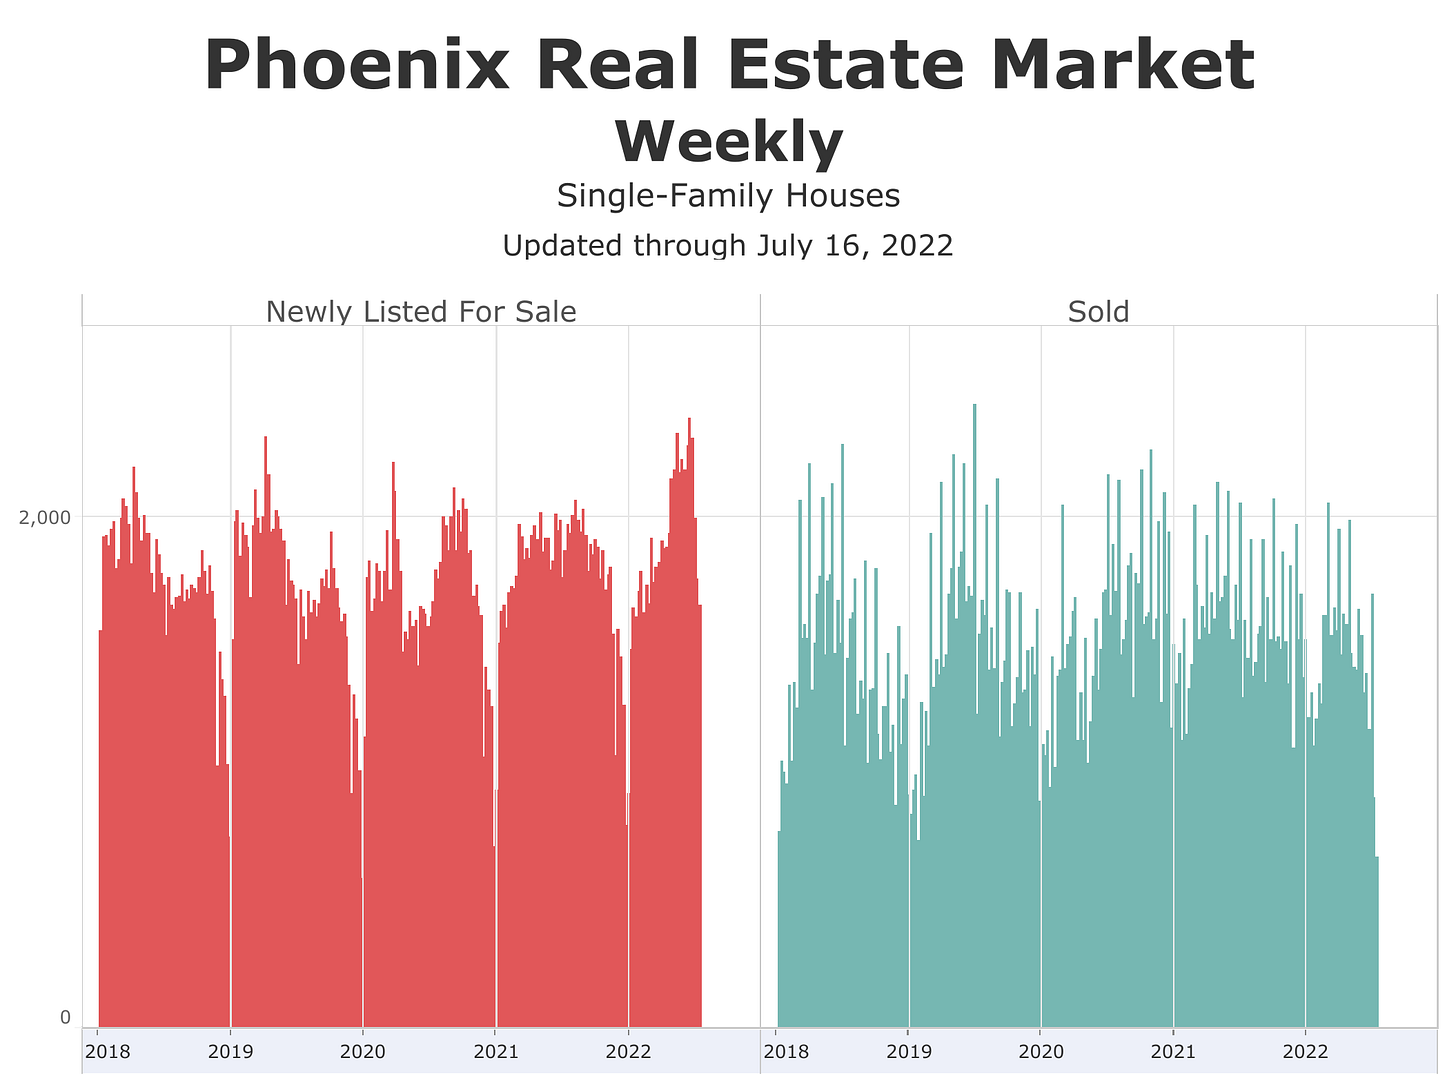
Let’s zoom in on New Listings and Solds.


This information can vary a lot in different parts of metro Phoenix. Your real estate agent can find the data for your specific city or zip code at The Cromford Report.

  • Phoenix Weekly Market Updates 2022

  • Phoenix Weekly Market Graph (only)

  • Long-term Phoenix real estate market graphs

Share

Share this post

Price per Square Foot of Sold Houses Down 4% in 1 Month in Phoenix

arizonarealestatenotebook.substack.com
Comments
TopNewCommunity

No posts

Ready for more?

© 2023 John Wake
Privacy ∙ Terms ∙ Collection notice
Start WritingGet the app
Substack is the home for great writing