


Supply Increasing Abnormally Right Now & Opendoor's Role in 2022's Falling Prices
Phoenix Homes Listed for Sale Surpassed 2019
Supply for Sale in MLS
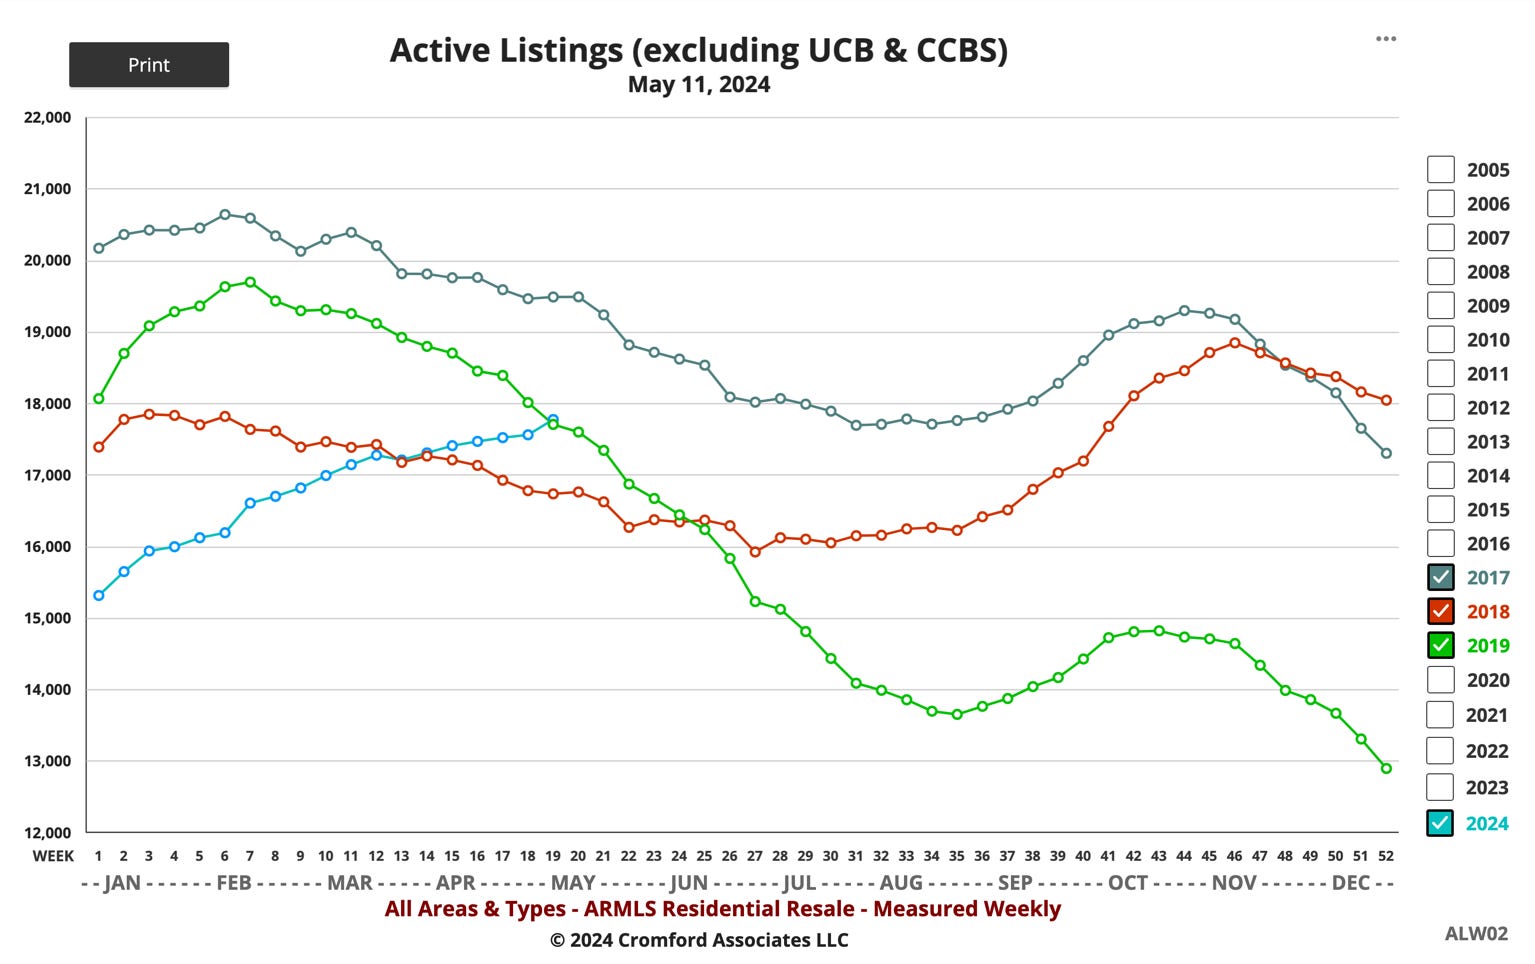
The number of homes for sale is at the low end of the "normal" range.
BUT seeing inventory increase this time of year is very abnormal.
Suggests inventory will continue increasing abnormally for a while
BUT the number of homes for sale was more than 3 times higher at the end of 2007 so this market is NOT at all comparable to the Great Real Estate Bubble.
iBuyers Caused the 2022 House Price Correction?
Mike at the Cromford Report mentions a theory about why prices tanked in the second half of 2022 that I've been considering for a long time - "distressed" sales by iBuyers caused it.
Mike emphasizes that iBuyers were desperate sellers selling below market value but more important in my mind is that iBuyers stopped buying homes.
Opendoor bought 700 homes in metro Phoenix in May 2022.
9 months later in February 2023, they bought 23.
Looking at Mike’s graphs more closely this morning, it’s clear to me the fall in Phoenix home prices in 2022 followed the crash in iBuyer home purchases MUCH more closely than it followed the increase in iBuyer home sales, although obviously, both were important.

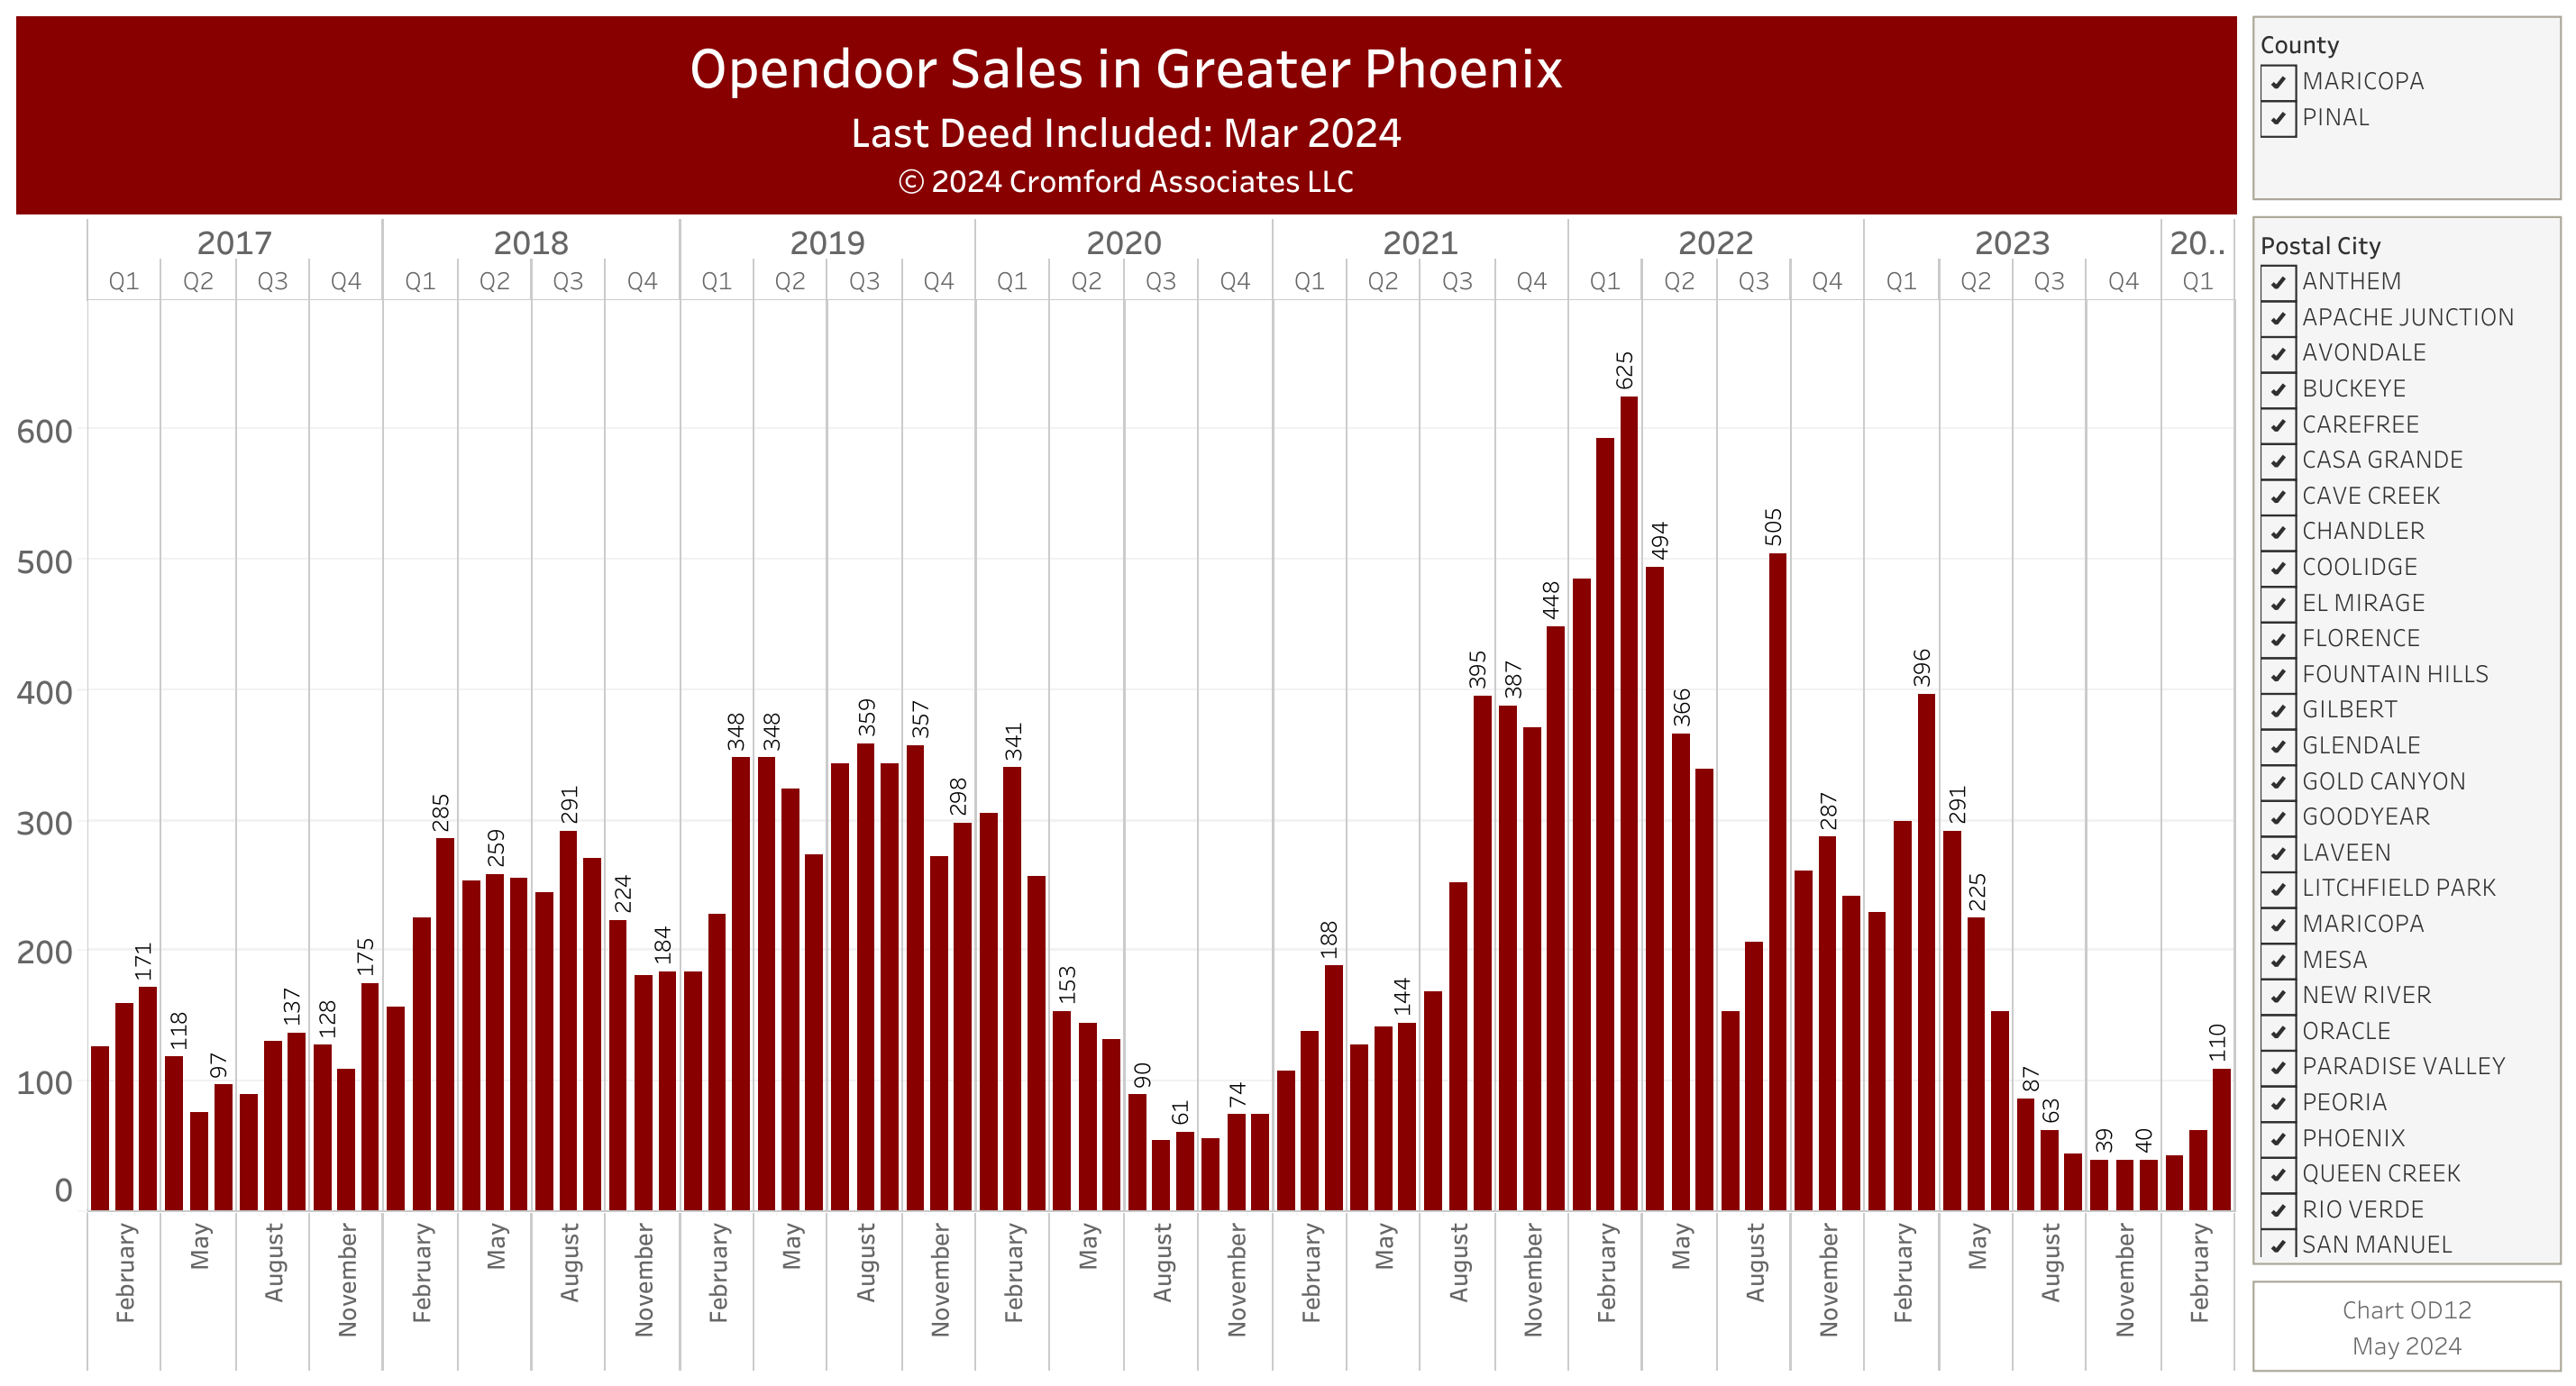
My ballpark guess this morning is that 10% or more of the increase in the number of homes for sale (and therefore, falling home prices) in metro Phoenix in 2022 was due to Opendoor cutting way back on buying homes which helped cause inventory to boom and prices to bust for a while.
The fall in iBuyer demand increased supply.
Click on the graphs to go to the full-size, interactive versions.

Notice how very small changes in New Listings and Solds eventually cause HUGE changes in the number of houses For Sale and house Prices (see graph above).

This information can vary a lot in different parts of metro Phoenix. Your real estate agent can find the data for your specific city or zip code at The Cromford Report.