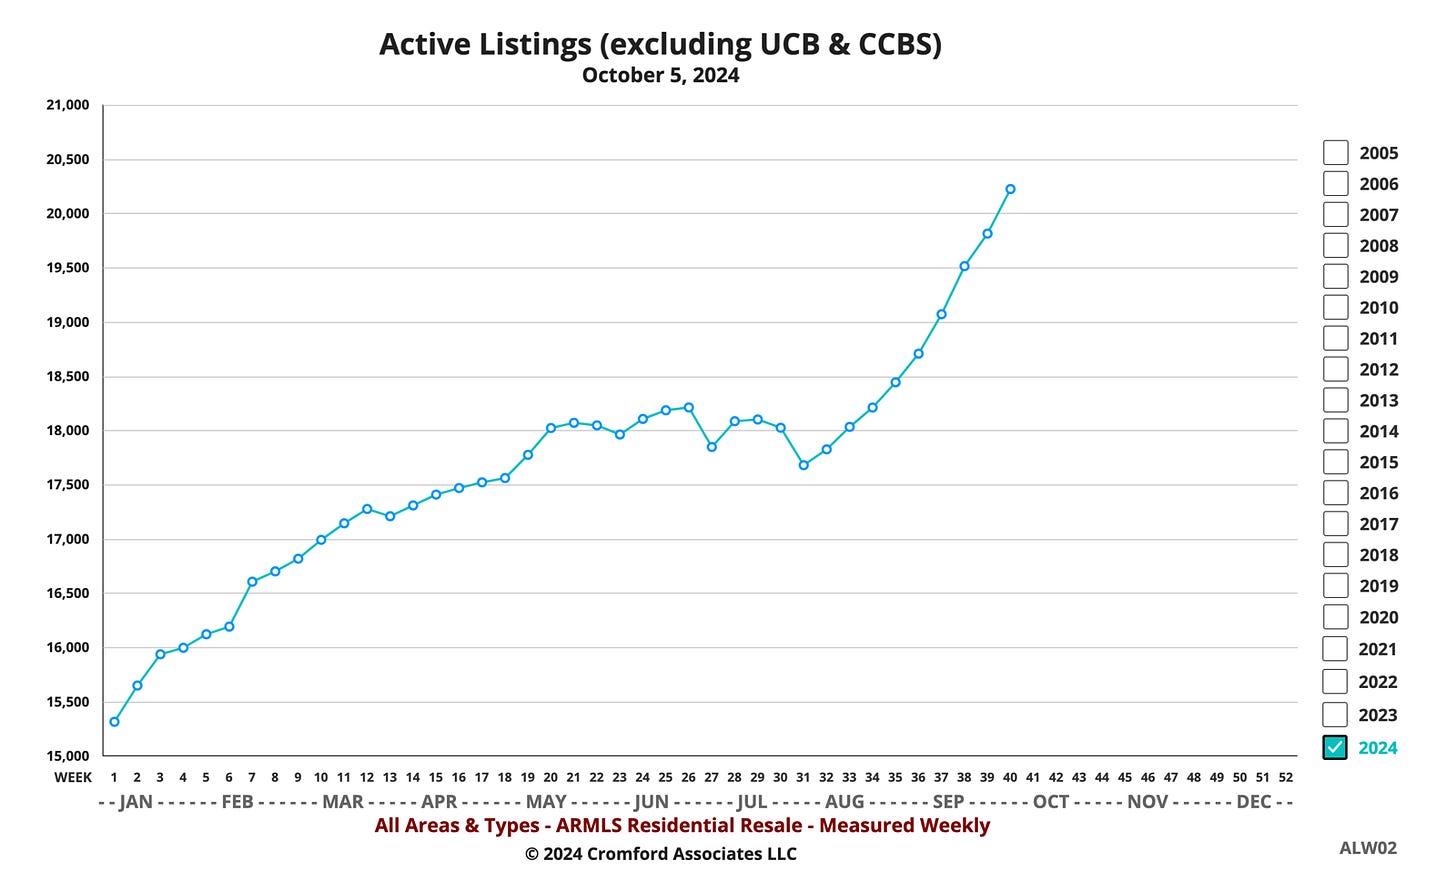
Supply of Homes for Sale in Phoenix Still Increasing Fast
But this graphic shows the number is currently kinda "normal" for this time of year.
And, this graphic shows the last 20 years to give you a better feel for where this year's supply fits in history.
By the end of the year, however, the Months of Supply of homes for sale in the Phoenix MLS could be the highest in a decade.
The Fed lowering interest rates hasn’t had an impact… yet.
Phoenix single-family home sold price in September was almost the same as in September 2023 and September 2022.
Nominal prices, not adjusted for inflation.
ZERO upward home price momentum.
Click on the graphs to go to the full-size, interactive versions.
Notice how very small changes in New Listings and Solds eventually cause HUGE changes in the number of houses For Sale and house Prices (see graph above).
This information can vary a lot in different parts of metro Phoenix. Your real estate agent can find the data for your specific city or zip code at The Cromford Report.


