

This Time is Different – 1 Reason Why
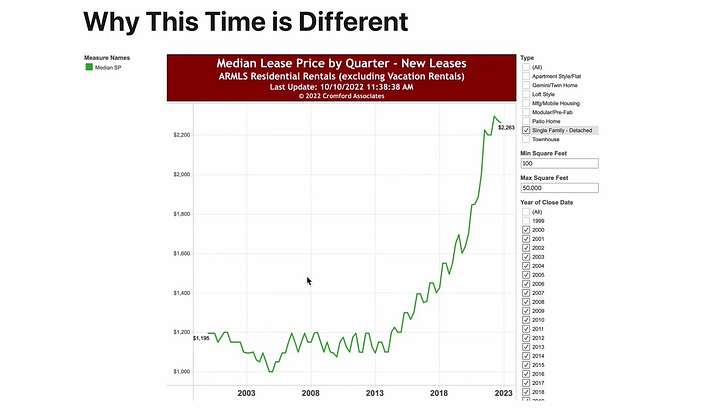
This Time Rents Also Skyrocketed

Calculated Risk Blog: “House Prices: 7 Years in Purgatory”
I agree with Bill McBride at Calculated Risk. Right now, this looks like the most likely scenario to me, too.
"I think the most likely scenario now is nominal house prices declining 10% or more from the peak, and real house prices declining 25% or so over the next 5 to 7 years."
That’s national. Phoenix will fall more than the U.S., of course. Phoenix is already down 8% from the peak in May so a total nominal decline of 20% or more in metro Phoenix would seem very likely in this scenario.
There are several reasons why that scenario might not play out but this afternoon I think it’s the most likely scenario.
Market Update
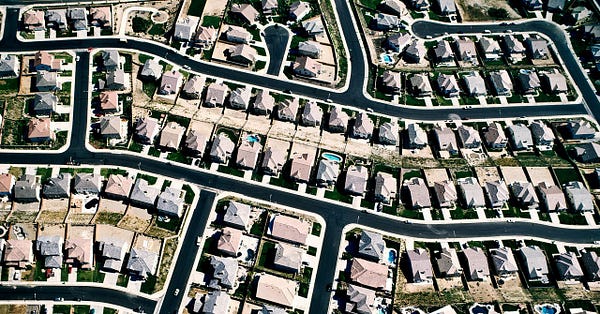
Phoenix - Single-Family Houses
Median sold price fell 7.8% from May to September.
Adjusted for inflation, the real median sold price fell ~9% over those 4 months (we don’t have CPI for September yet).
2 Markets in 1
Overall, the number of single-family houses for sale is up 168% compared to the same week a year ago but only up 18% compared to the same week in 2018, a more “normal” year.

But for houses under 2,000 square feet (about half of all sales), the number of single-family houses for sale is up 218% compared to the same week a year ago and up 58% compared to the same week in 2018, a more “normal” year. So, we have a LOT more of those houses listed for sale in the MLS than “normal”.

Takeaway. If you're selling a single-family house under 2,000 square feet in metro Phoenix, you’ve got a ton of competition. If you’re buying, you’ve got a ton of houses to choose from.
Why This Time is Different

This is Cool!
This piece from James Pethokoukis at the Washington DC think tank AEI, links to a piece I wrote for Forbes.com!

He discusses how all the housing information online today may speed up things so house price changes may have a bigger, quicker political impact now than in the past.
Quick Tweets
"The median monthly cost to live in a Phoenix apartment fell 1% in September, according to Apartment List. Rents also fell in eight other Valley cities. Nationally, rents fell by only 0.2%."
"Metro Phoenix’s apartment vacancy rate has ticked up this year, and evictions have climbed to a 13-year high. Construction of new apartment complexes is up too"


Click on the graphs to go to the full-size, interactive version.

Notice how very small changes in New Listings and Solds eventually cause HUGE changes in the number of houses For Sale and house Prices (see graph above).

This information can vary a lot in different parts of metro Phoenix. Your real estate agent can find the data for your specific city or zip code at The Cromford Report.