Mike Orr of The Cromford Report - Recent Quotes
Mike is a total expert on the Phoenix real estate market. He is NOT a permabear which makes his worried outlook a lot more worrisome.
July 3
All Home Types
Active Listings: 14,406 versus 5,699 last year - up 152.8% - and up 52.6% from 9,439 last month
Pending Listings: 5,766 versus 7,294 last year - down 20.9% - and down 16.3% from 6,887 last month
Under Contract Listings: 8,621 versus 11,378 last year - down 24.2% - and down 15.9% from 10,249 last month
Monthly Sales: 8,059 versus 10,184 last year - down 20.9% - and down 7.7% from 8,734 last month
Monthly Median Sales Price: $474,374 versus $397,000 last year - up 19.5% - but down 0.1% from $475,000 last month
“The rise in supply has been faster than ever seen before… active listings up 53% in a single month and up 153% compared to this time last year… percentage changes are far above anything we have previously experienced.”
“Monthly sales are down 21% from June 2021 and down 8% compared with May 2022.”
“When a housing cycle changes from positive to negative, we normally go from euphoria to uneasiness for a few months, followed by several months of denial and then several more months of pessimism before we get to the panic phase. This is what played out in 2005 and 2006. But in 2022 we seem to have taken just a week or two to skip through each of these steps and gone from euphoria to panic in no more than 10 weeks… In combination they caused the market to hit the brakes so hard it has skidded off the road.”
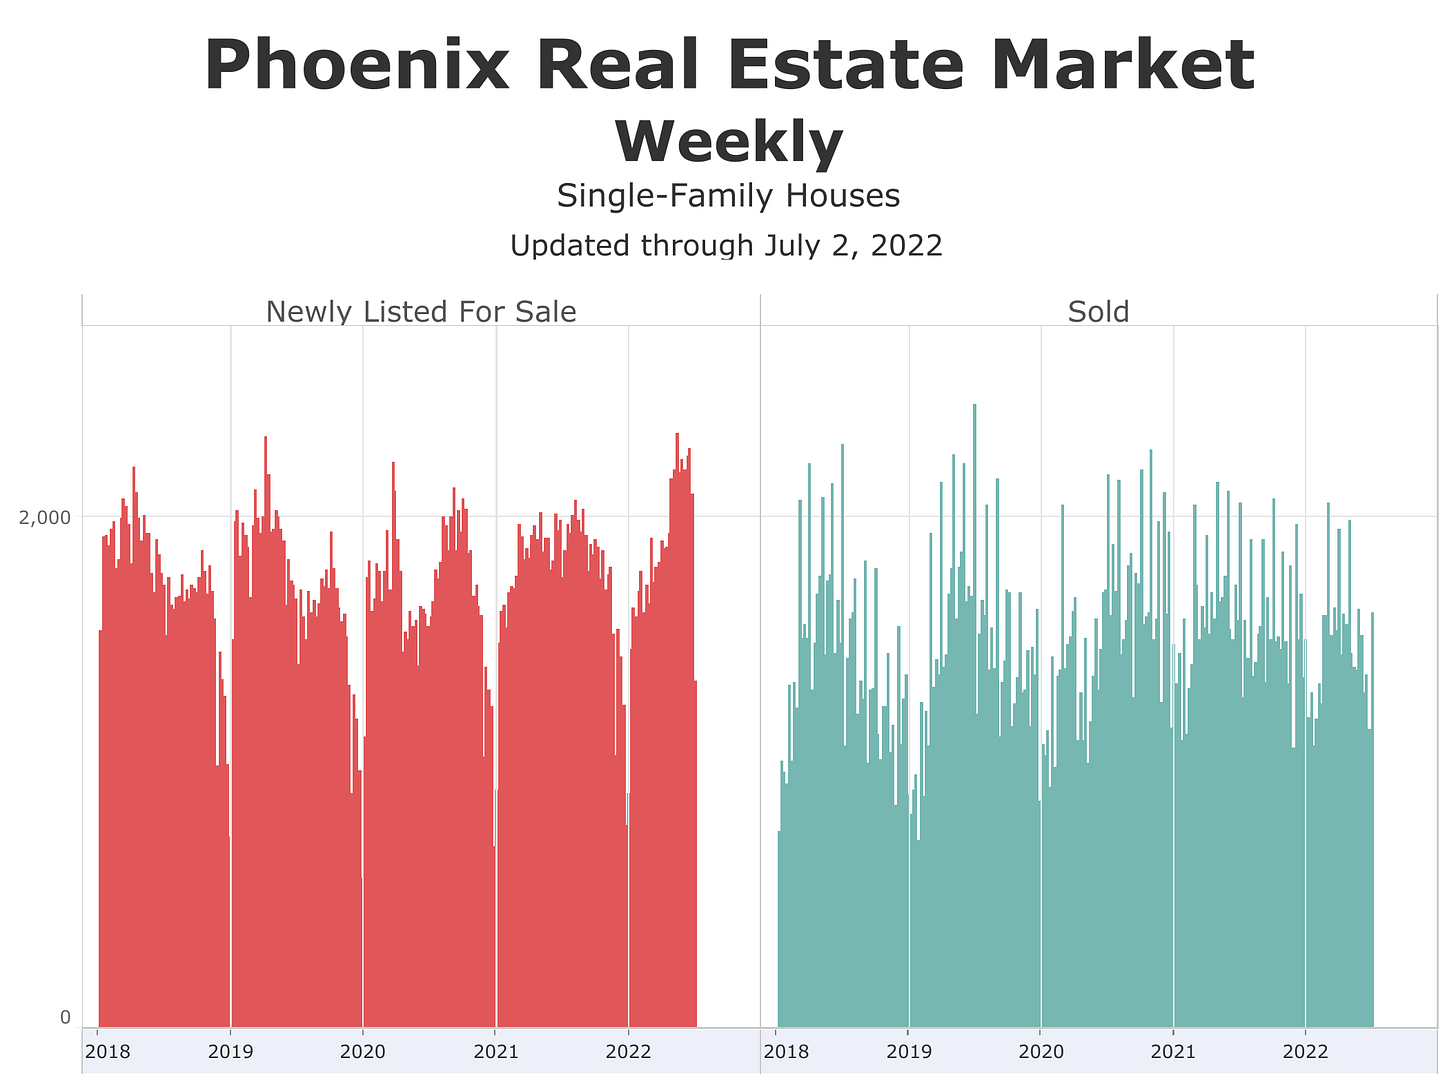
“June 25 saw the highest ever weekly total of new listings being added to ARMLS [Phoenix area MLS]”
“Those who measure monthly are almost flying blind.”
July 1
“The collapse between April and June is unprecedented - faster and more violent than we have ever witnessed… explosive rise in supply.”
“The contract ratio is telling us that we are already in a balanced market.”
June 26
“we have had a very chilly wind blowing through the market.”
“There were just 1,558 accepted contracts during last week, down from 1,898 the week before and 2,274 during the same week in 2021… It is even lower than during the first covid-19 wave in April 2020.”
“We have a full-on buyer's strike developing.”
“more homes are being newly listed for sale than at any time since 2011. The active listing count (without a contract) rose 12% last week…. We are witnessing a full-on seller's stampede.”
“The stampede for the exit is now large enough that it is certain to do significant damage to home values.”
“When a buyer's strike and a seller's stampede occur at the same time, the market stalls in mid-flight.”
Number of Single-Family Houses for Sale in Phoenix Area MLS
The red line is 2022. The green line is 2019, pre-pandemic.
I had 2 articles in Forbes.com recently!
Click on the graphs to go to the full-size, interactive version.
Let’s zoom in on New Listings and Solds.
This information can vary a lot in different parts of metro Phoenix. Your real estate agent can find the data for your specific city or zip code at The Cromford Report.


If it weren't for the buyer's strike, it would be easy to conclude that the market is simply returning to normal after the pandemic. Inventory has been insanely low the last few years, so it's no surprise that we would see huge inventory increase percentages as the market recovers. The "uh oh" part is the decline in sales. Huge inventory increases and declines in sales numbers mean lower prices are soon to follow.