


Why the Supply of Homes for Sale is Increasing
Phoenix Supply of Homes for Sale
Up 43% from Last Year at this Time
Highest in 10 Years (since 2014)
Rising when Usually Flat or Falling

Why Supply is Increasing
The number of homes sold so far this year is the same as last year.
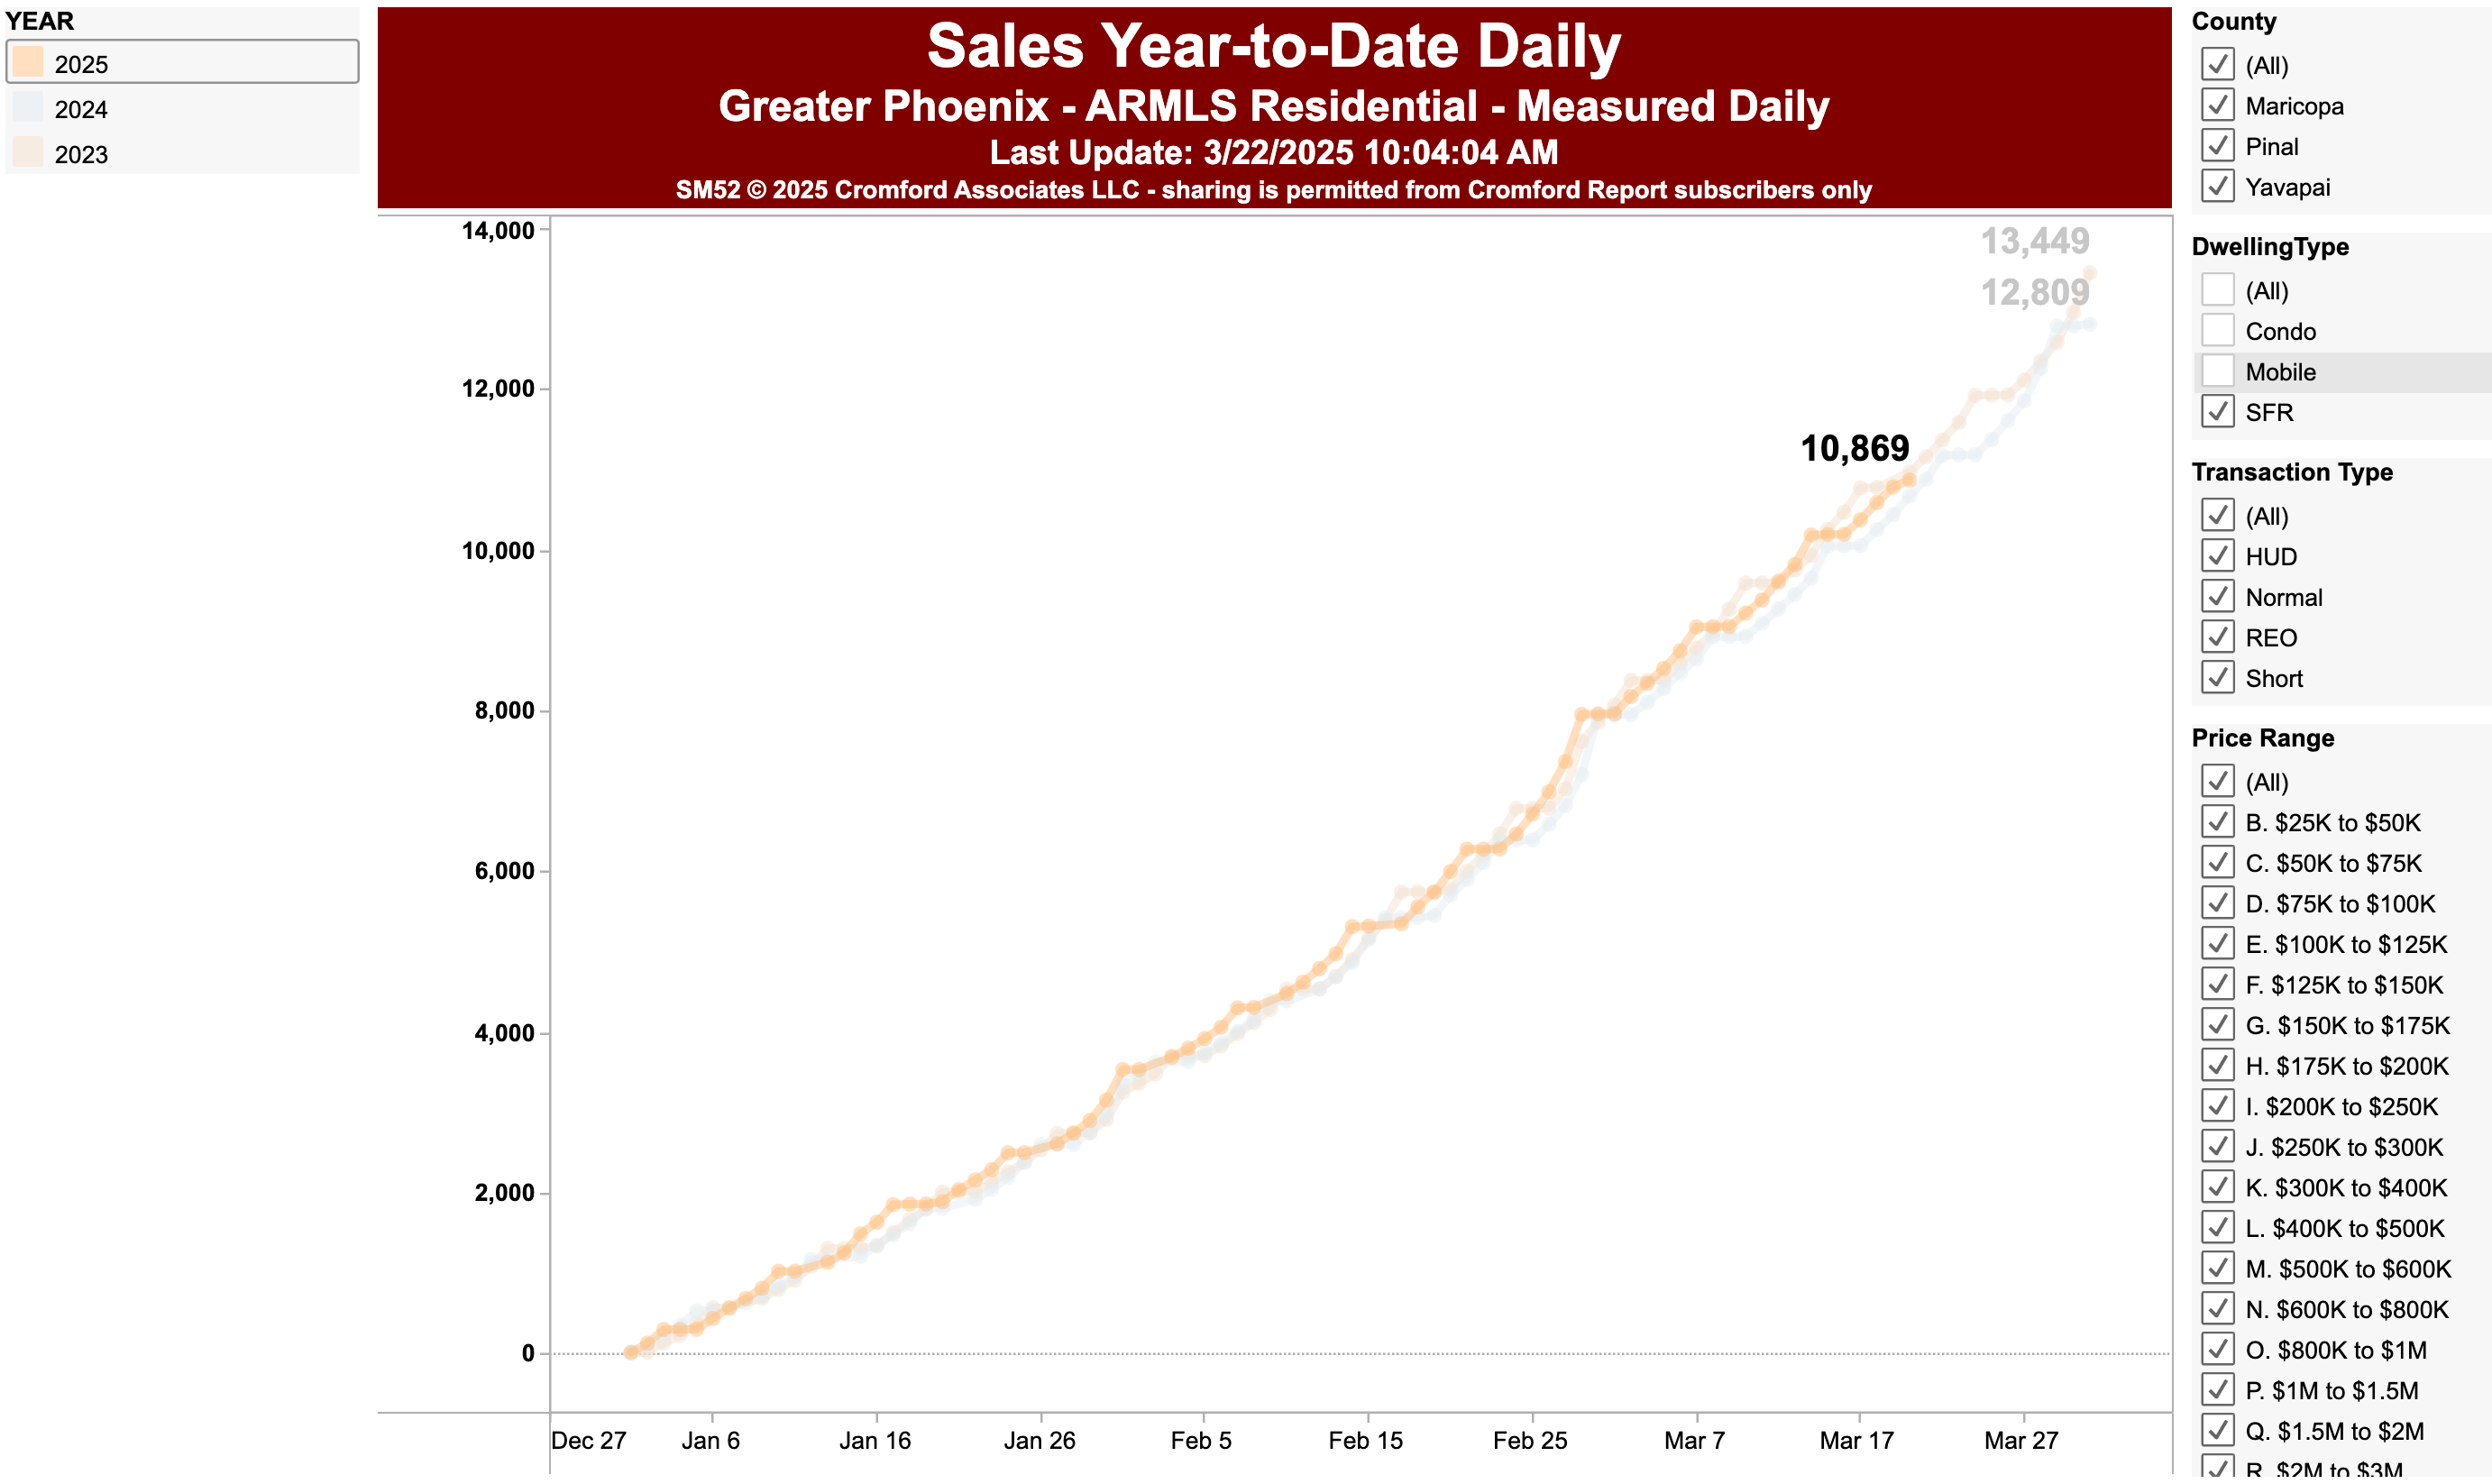
BUT the number of homes hitting the market is up a total of 18% from last year.

So, the supply of homes for sale is increasing every week.
I’m trying to figure out why more people are trying to sell their homes this year. What do you think? Leave a comment.
Home Prices the Same as 4 Years Ago!
Real, inflation-adjusted home prices in metro Phoenix in February were the same as in the spring of 2021, nearly 4 years ago.
There’s zero upward momentum in real home prices.

Single-Family Home Prices (Not Adjusted for Inflation) Similar to 3 Years Ago

Supply Myth
Zoning and building permits are NOT restricting new housing supply.
233,000 building permits were authorized in metro Phoenix from 2020 to 2024, according to this U.S. Census Bureau data.

Riparian Preserve at Water Ranch in Gilbert
We really enjoyed walking around the water with some visiting relatives who are birders.

Click on the graphs to go to the full-size, interactive versions.

Notice how very small changes in New Listings and Solds eventually cause HUGE changes in the number of houses For Sale and house Prices (see graph above).

This information can vary a lot in different parts of metro Phoenix. Your real estate agent can find the data for your specific city or zip code at The Cromford Report.